Annual Report to Parliament 2020
PDF Version (6.78 MB, 91 pages)
For information regarding reproduction rights, please contact: communicationspublications@canada.ca
Table of contents
Message from the Minister

As Minister of Indigenous Services, I am pleased to share the first ever Indigenous Services Canada annual report to Parliament. The Department of Indigenous Services Act received royal assent on June 21, 2019, legally establishing the new department and its mandate to implement the gradual transfer of departmental responsibilities to Indigenous governments and organizations. This new structure and mandate originates from the important work done by the Royal Commission on Aboriginal Peoples and its 1996 report that made many insightful recommendations still relevant today. As Prime Minister Trudeau stated in announcing the creation of two new departments: "Over twenty years ago, the Royal Commission on Aboriginal Peoples acknowledged that a new relationship with Indigenous peoples would require new structures. It recommended that we dramatically improve the delivery of services while accelerating a move to self-government and self-determination of Indigenous peoples. One mechanism to achieve this was the dissolution of Indigenous and Northern Affairs Canada (INAC) and the creation of two new ministries to facilitate this work." As Crown-Indigenous Relations and Northern Affairs Canada works to advance a nation-to-nation, Inuit-to-Crown, government-to-government, relationship based on rights and respect, Indigenous Services Canada will bolster these efforts by working with Indigenous peoples to support their agency over the design and delivery of services essential to their communities' wellbeing and critical to their self-determination. In the provision of essential services, it is incumbent upon the department to provide funding that is sufficient, stable and predictable in order to close socioeconomic gaps, advance substantive equality, and facilitate a successful transfer of departmental responsibilities to Indigenous organizations. The pandemic that swept the world has had its effect in Canada.
This report provides a general summary of recent COVID-19 measures taken to address service-delivery measures to improve the health and socioeconomic outcomes of Indigenous communities affected by the COVID-19 pandemic, however the collection of further distinctions-based data is underway. Our government's top priority is to continue our efforts to address related impacts, while focusing on economic recovery. Throughout this pandemic, my priority has been to support Indigenous communities to prepare, plan and respond to COVID-19 while thinking about how shorter- and medium-terms measures can contribute to longer-term prosperity. The pandemic has offered an opportunity to think about the needs of Indigenous communities, and has resulted in meaningful conversations that will assist us to build a recovery plan for First Nations, Inuit, and Métis communities effected by COVID-19.
The necessity and urgency of this important work was highlighted during the COVID-19 pandemic. Indigenous communities are incredibly resilient and full of solutions and innovative ideas, as continues to be demonstrated once again throughout the COVID-19 pandemic. This is why measures to improve the health and socioeconomic outcomes of Indigenous communities must be flexible to enable communities to address the specific needs they have identified, in recognition of their right to self-determination.
The Department of Indigenous Services Act stipulates that the annual report to Parliament will describe:
- the socio-economic gaps between First Nations, Inuit, and Métis individuals and other Canadians and the measures taken by the department to reduce those gaps; and
- the progress made towards the transfer of departmental responsibilities to Indigenous organizations.
This report will do so with substantive equality between Indigenous peoples and other Canadians being the overarching goal behind departmental efforts. Substantive equality is a legal principle that refers to the achievement of true equality in outcomes. It is achieved through equal access and opportunity. Most importantly, it is achieved through the provision of services and benefits in a manner and according to standards that meet any unique needs and circumstances, such as cultural, social, economic and historical disadvantage. Success over the long-term will be measured by the extent to which substantive equality is achieved. It has been well-established that Indigenous people in Canada have suffered as a result of systemic racism – as evidenced by, for example, the implementation of the residential school system and the child welfare programs/policies referred to as the 60's Scoop. This historical disadvantage (too often implemented in a context of institutionalized racism) demands acknowledgement and redress if we are to advance a reconciliation agenda with Indigenous partners.
It is for this reason that An Act respecting First Nations, Inuit and Métis children, youth and families makes explicit reference to interpreting and administering the Act in accordance with the principles of substantive equality; "in order to secure long-term positive outcomes for Indigenous children, families and communities". This Act received Royal Assent on National Indigenous Peoples Day June 21, 2019; the same day as the legislation legally enabling Indigenous Services Canada. The pursuit of substantive equality and addressing historical disadvantage will inform Indigenous Services Canada policies and programming, as seen in such endeavors as: ensuring provincial comparability in education funding while providing additional language and culture investments; providing increased funding predictably and flexibility through 10-year grants; implementing the Canadian Human Rights Tribunal orders prior to September 2019; efforts to close infrastructure gaps; work to transform Indigenous health services such as the First Nations Health Authority in British Columbia; and, implementing the United Nations Declaration on the Rights of Indigenous Peoples.
As the newly created department of Indigenous Services Canada continues the work of transferring control over the design, implementation and management of essential services, we know that our efforts must be guided by more respectful ways of working with Indigenous peoples, including listening, being responsive, and forging true partnerships. Indeed, this is the only real path to achieving our important mandate of closing socioeconomic gaps, increasing access to services, and the gradual transfer of those services along with adequate funding, to Indigenous organizations.
To meet our goals of closing socioeconomic gaps and achieving substantive equality, we need information and data to measure progress and identify areas of particular concern. We recognize the importance of this information to Indigenous partners and acknowledge that current distinctions-based Footnote 1 data for Indigenous peoples is woefully insufficient. The data shared in this report is, therefore, a starting point. We are committed to enriching our data sets in each subsequent annual report based on co-developed work that is already underway.Footnote 2 Through emerging tools like the 10-year grants, the First Nations Regional Health Survey, and the Inuit Health Survey, we will be able to share increasingly robust data with Indigenous partners that leads to strengthened policy decisions, targeted approaches, and long-term change. We are also committed to improving data in specific areas like Indigenous education and child and family services to more accurately measure and close these gaps.
We have made important progress in the short time since the creation of Indigenous Services Canada, though we know we are closer to the beginning of our journey than the end. I welcome this opportunity to describe these efforts so far and to further define how we are working to make greater strides going forward in collaboration with Indigenous partners.
I hope this report proves useful in creating a common understanding of these efforts and serves to highlight the importance of Indigenous self-determination to Canada's social cohesion, economy, and people.
The Honourable Marc Miller
Minister of Indigenous Services Canada
Introduction
The Department of Indigenous Services Act and the annual report to Parliament
In August 2017, the Government of Canada announced that Indigenous and Northern Affairs Canada would be dissolved and replaced by two new departments; Indigenous Services Canada and Crown-Indigenous Relations and Northern Affairs Canada.
The Department of Indigenous Services Act came into force on July 15, 2019. The Act opens by confirming that:
the Government of Canada is committed to achieving reconciliation with First Nations, the Métis and the Inuit through renewed nation-to-nation, government-to-government and Inuit-Crown relationships based on affirmation and implementation of rights, respect, cooperation and partnership, promoting respect for the rights of Indigenous peoples recognized and affirmed by section 35 of the Constitution Act, 1982, and implementing the United Nations Declaration on the Rights of Indigenous Peoples;
and establishes the new department of Indigenous Services Canada which, in carrying out its activities:
Ensures that Indigenous individuals have access – in accordance with transparent service standards and the needs of each Indigenous group, community or people – to services for which those individuals are eligible,
Takes into account socioeconomic gaps that persist between Indigenous individuals and other Canadians with respect to a range of matters as well as social factors having an impact on health and well-being,
Recognizes and promotes Indigenous ways of knowing, being and doing,
Collaborates and cooperates with Indigenous peoples and with the provinces and territories, and
Implements the gradual transfer of departmental responsibilities to Indigenous organizations.
This document is the department's first Annual Report to Parliament, which is required by the Act and described therein as follows:
The Minister must cause to be tabled in each House of Parliament, within three months after the end of the fiscal year or, if the House is not then sitting, on any of the 15 days of the next sitting of the House, a report on (a) the socioeconomic gaps between First Nations individuals, Inuit, Métis individuals and other Canadians and the measures taken by the Department to reduce those gaps; and (b) the progress made towards the transfer of departmental responsibilities to Indigenous organizations.
This first annual report to Parliament is organized into three parts. Part 1 provides a broad overview of the socioeconomic gaps between First Nations, Inuit, and Métis peoples, and the non-Indigenous population in Canada. It covers a wide range of social, economic, and health dimensions, ranging from income and education through life expectancy and language use, and highlights not only what gaps exist today, but how those gaps have evolved over time. This section also highlights why measurement is so important, and the ongoing work being done to address persistent data gaps to make measurement more effective.
Part 2 focuses on the steps that Indigenous Services Canada has taken over the past five years to address specific socioeconomic gaps, as one of a network of federal, provincial/territorial, and local governments providing services to Indigenous people in Canada. This section will discuss the specific activities and initiatives Indigenous Services Canada has undertaken in order to ensure that Indigenous peoples achieve substantive equality: the true equality in outcomes that is achieved through equal access, equal opportunity and the provision of services and benefits in a manner that meets any unique needs and circumstances such as cultural, social, economic, and historical disadvantage (e.g., addressing service gaps, program funding shortages and adjusting policies to achieve better outcomes and meeting population needs).
Part 3 focuses on how the department has been working with Indigenous partners to advance the complex process of transferring control over services to Indigenous peoples. In fulfilling its legislated priority to implement the "gradual transfer of departmental responsibilities to Indigenous organizations," Indigenous Services Canada is working towards a fundamental change in how the rights and needs of Indigenous peoples and communities are addressed by the Government of Canada. This is not a single initiative, but a significant shift in the Government of Canada's role across all public services for Indigenous peoples. By necessity, this shift will not happen overnight or by using a single approach or model. It will take place by working in partnership with Indigenous communities and organizations to find the best paths forward at a pace determined by Indigenous partners. Services for Indigenous peoples continue to be delivered through a complex array of programs, authorities and agreements reflecting the wide range of geographic and socioeconomic realities, as well as the legal and historical contexts of Indigenous communities. It is essential that the new arrangements respect the distinct needs and preferences of First Nations, Inuit, and Métis peoples and uphold treaty rights and federal obligations.
This first report to Parliament presents the department's approach to fulfilling the legislated mandate on transfer of responsibilities and reports on initial advancement of this work. In future years, Indigenous Services Canada will report on the development of partnerships and co-development processes or transfer agreements as well as on empirical metrics of Indigenous control over services that will allow for transparent monitoring of progress.
A note on terminology
We wish to acknowledge at the outset that the use of some terms in this document may be offensive and problematic for some that will read this report. While language in Canada used to describe and speak about Indigenous peoples is evolving to be more respectful and reflective of how Indigenous peoples and communities themselves choose to be identified, there remains some pieces of legislation that continue to use outdated and colonial terminology.
For example, Canada's Constitution Act, 1982 recognizes three distinct "aboriginal peoples of Canada" – "Indian, Inuit, and Métis." The Government of Canada now uses the terms "Indigenous" and "First Nations", however, "Aboriginal" and "Indian" remain the legal terms that continue to be used in certain circumstances.
Also, as the Indian Act, a very outdated and colonial piece of legislation, continues to be in effect terms such as "registered Indian" (also referred to as status Indian) remain in use. Given that these remain accepted legal terms, for the purposes of this report, which requires reference to the Indian Act and its provisions and requires precision in terminology for statistical purposes, the legal terms will be usedFootnote 3.
It is also important to note, that this report uses "Indigenous organizations" to describe the entities to which responsibility for service delivery will be transferred. This term is reflective of the language used in the Department of Indigenous Services Act and is intended to cover a wide range of entities that may take responsibility for the delivery of services including Indigenous governments, authorities, institutions, and organizations, as determined in partnership with Indigenous peoples and communities.
Part 1:
Indigenous populations in Canada
'Indigenous peoples' is a collective name for the original peoples of North America and their descendants. More than 1.67 million people in Canada (4.9% of the population of Canada) self-identified as an Indigenous person on Canada's 2016 Census of Population.Footnote 4 Indigenous peoples are the fastest growing population in Canada, with a population that grew by 42.5% between 2006 and 2016.Footnote 5 Indigenous peoples are also the youngest population in Canada: about 44% were under the age of 25 in 2016, compared to 28% of the non-Indigenous population.
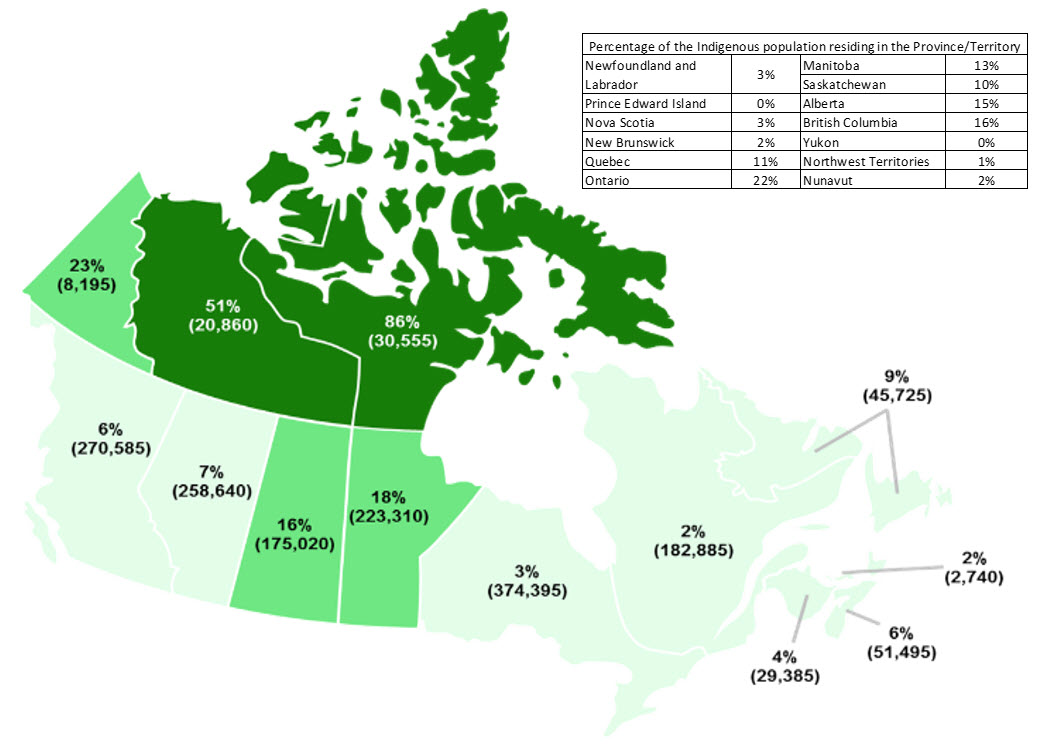
Figure 1 shows the distribution of Indigenous populations across Canada. The figure includes the number of Indigenous individuals living in each province and territory, as well as what proportion of its overall population comprises Indigenous peoples. Indigenous peoples make up the largest proportion of the population in Nunavut (86%), the Northwest Territories (51%) and the Yukon Territory (23%), followed by Manitoba (18%) and Saskatchewan (16%).
The inset table indicates what proportion of the overall Indigenous population resides in each province and territory. Although Indigenous peoples comprise only 3% of Ontario's population, it is home to the largest population of Indigenous peoples: 374, 395 individualsFootnote 6 or 22% of the Indigenous population; 16% of the Indigenous populations resides in British Columbia; followed by 15% in Alberta.
Text alternative for Figure 1: Indigenous Peoples across Canada
| Indigenous | ||
|---|---|---|
| Population size | Percentage | |
| Newfoundland and Labrador | 45,730 | 9% |
| Prince Edward Island | 2,735 | 2% |
| Nova Scotia | 51,490 | 6% |
| New Brunswick | 29,380 | 4% |
| Quebec | 182,890 | 2% |
| Ontario | 374,395 | 3% |
| Manitoba | 223,310 | 18% |
| Saskatchewan | 175,020 | 16% |
| Alberta | 258,640 | 7% |
| British Columbia | 270,585 | 6% |
| Yukon | 8,195 | 23% |
| Northwest Territories | 20,860 | 51% |
| Nunavut | 30,550 | 86% |
| Percentage of the Indigenous population residing in the Province/Territory | |
|---|---|
| Newfoundland and Labrador | 3% |
| Prince Edward Island | 0% |
| Nova Scotia | 3% |
| New Brunswick | 2% |
| Quebec | 11% |
| Ontario | 22% |
| Manitoba | 13% |
| Saskatchewan | 10% |
| Alberta | 15% |
| British Columbia | 16% |
| Yukon | 0% |
| Northwest Territories | 1% |
| Nunavut | 2% |
The Canadian Constitution recognizes three groups of Indigenous peoples: First Nations, Inuit, and Métis. These are three distinct peoples with unique histories, languages, cultural practices and spiritual beliefs. Figure 2 shows how the composition of Indigenous populations vary across the provinces and territories, and additional information on each of the groups is provided below.

Text alternative for Figure 2: Composition of the Indigenous population in Canada, 2016
| Registered Indian | Non-Status Indian | Inuit | Métis | Other Indigenous | |
|---|---|---|---|---|---|
| Newfoundland and Labrador | 46% | 23% | 14% | 14% | 2% |
| Prince Edward Island | 44% | 29% | 3% | 23% | 1% |
| Nova Scotia | 37% | 20% | 2% | 40% | 1% |
| New Brunswick | 49% | 17% | 1% | 31% | 2% |
| Quebec | 42% | 16% | 8% | 33% | 1% |
| Ontario | 46% | 23% | 1% | 29% | 1% |
| Manitoba | 57% | 4% | 0% | 38% | 1% |
| Saskatchewan | 63% | 5% | 0% | 32% | 0% |
| Alberta | 48% | 9% | 1% | 41% | 1% |
| British Columbia | 50% | 17% | 1% | 30% | 2% |
| Yukon | 72% | 13% | 3% | 11% | 1% |
| Northwest Territories | 64% | 4% | 19% | 13% | 0% |
| Nunavut | 1% | 0% | 99% | 0% | 0% |
*Other Indigenous refers to respondents who reported more than one identity group, and those who reported being a Band member with no Aboriginal identity and no Registered Indian status.
First Nations
The term 'First Nations people' includes Registered Indians (also called Status Indians) and Non-Status Indians. Registered Indians are individuals registered as Indians under the Indian Act. According to the Census of Canada, there were 820,120 Registered Indians in Canada in 2016, comprising 49% of the Indigenous population. According to the Indian Register, which is an administrative list of all Registered Indians that is maintained by Indigenous Services Canada, there were 970,562 Registered Indians in 2016, and 1,008,955 as of December 30, 2019.Footnote 7
There are 634Footnote 8 First Nation communities in Canada, which represent more than 50 Nations and 50 Indigenous languages.
According to the 2016 Census of Canada, about 40% of Registered Indians live on reserve, 14% live in rural areas (off reserve), and 45% live in urban areas.Footnote 9 70% of First Nations reserve communities have less than 500 inhabitants, while only 4% percent have more than 2,000 inhabitants. They can be relatively urban or extremely remote, and exist throughout Canada. Many First Nations have signed treaties with the Crown.
Non-Status Indians live almost exclusively off reserve. Non-Status Indians account for 14% of the Indigenous population, and about 76% live in urban areas.
Inuit
Inuit are the Indigenous people of the Arctic. The word Inuit means "the people" in the Inuit language of Inuktut. The singular of Inuit is Inuk.
Inuit comprise only 4% of the total Indigenous population, with 64,325 individuals identifying as Inuit on the 2016 Census. The majority (73%) of Inuit live in Inuit Nunangat, which means "the homeland" and represents a third of Canada's land mass and 50% of its coastline. Inuit Nunangat comprises 51 communities across four regionsFootnote 10: Inuvialuit Settlement Region (Northwest Territories and YukonFootnote 11), Nunavut, Nunavik (northern Quebec), and Nunatsiavut (Labrador).
Métis
The term Métis is used to describe communities of mixed European and Indigenous descent across Western Canada, and is defined by the Métis Nation of Canada as a specific community of people, which comprises "distinct Métis communities developed along the routes of the fur trade and across the Northwest within the Métis Nation Homeland. This Homeland includes the three Prairie Provinces (Manitoba, Saskatchewan, Alberta), as well as, parts of Ontario, British Columbia, the Northwest Territories and the Northern United States."Footnote 12
According to the 2016 Census, there are 537,855 Métis in Canada, representing about 32% of the Indigenous population. At present, the Census does not distinguish members of the Métis Nation from others who self-identify as Métis.
Measuring the socioeconomic gaps
Why measurement is important
First, continued measurement helps determine whether progress is being achieved over time.
Second, ongoing measurement can help demonstrate whether existing programs and policies are properly designed and resourced, and if there are program and policy gaps that must be addressed.
Third, by tracking program and policy performance and identifying gaps, measurement can help ensure accountability of those who design and implement those programs and policies.
Finally, measurement calls for reflection to define, in a clear and transparent way, what progress means. By stimulating conversation and inviting challenge, the iterative process of defining how to measure progress focuses attention on the things that truly matter.
What is important to measure
The socioeconomic and healthFootnote 13 dimensions addressed in this report, including related indicators, were selected based on a review of the various socioeconomic wellness frameworks being used around the worldFootnote 14, in addition to numerous indicators and frameworks related to well-being and progress that First Nation, Inuit, and Métis governments and organizations have developed and shared with the public online. Where possible, the specific indicators used to measure the different dimensions were based on established national or international methodologies.
Examining gaps between Indigenous and non-Indigenous populations is an important way of putting numbers in context. Without a basis for comparison, raw statistics are difficult to interpret. As we will see shortly, for example, the employment rate for Métis is about 70%. It is only by looking at this number in relation to the employment rate for the non-Indigenous population (about 76%), that one can get a sense that the rate for Métis is not as high as it could be, and that there may be a need to address systemic barriers, or enduring effects of past injustices, to support Métis to achieve their employment goals.
It is sometimes suggested that focusing on gaps between different populations is inappropriate as it potentially involves an implicit value judgement. It suggests that the lower-scoring population should aspire to the level of the higher-scoring population on a particular indicator, even if the indicator is of little importance to the lower-scoring population. This is a fair critique, and is why the current report focuses on key socioeconomic indicators that appear regularly in Indigenous wellness frameworks, as well as being recognized internationally as important to quality of life in most cultural contexts. The inclusion of additional indicators, the importance of which might vary across Indigenous and non-Indigenous populations, will be done in close consultation with First Nations, Inuit, and Métis for subsequent iterations of this annual report. One exception is knowledge of Indigenous languages, which was included in this inaugural report since it is a well-established priority for many Indigenous peoples.
The indicators
The complete set of indicators addressed in this chapter is listed below, with analyses of each indicator presented in turn in the pages that follow.
| Domain | Indicator | Data Source |
|---|---|---|
| Income | Median income Median total income for the working age populationFootnote 15, Footnote 16 |
Census of Canada, 2006, 2011Footnote 17, 2016 |
| Poverty Percentage of the population that lived in a low income situation in the year preceding the Census |
Census of Canada, 2006, 2011, 2016 | |
| Employment | Employment rate Percentage of the working age population that was employed on Census reference day |
Census of Canada, 2001, 2006, 2011, 2016 |
| Median employment income Median employment income received by the working age population in the year prior to the Census |
Census of Canada, 2006, 2011, 2016 | |
| Education | High school completion Percentage of the working age population who had a high school diploma, or who had a post-secondary credential even though they did not complete high school |
Census of Canada, 2001, 2006, 2011, 2016 |
| University completion Percentage of the working age population with a university degree |
Census of Canada, 2001, 2006, 2011, 2016 | |
| Family | Foster care Percentage of children and youth aged 0-17 in foster care |
Census of Canada, 2011, 2016 |
| Culture | Indigenous language knowledge Percentage of the population that is able to carry on a conversation in an Indigenous language |
Census of Canada, 2001, 2006, 2011, 2016 |
| Housing | Crowding Percentage of dwellings classified as crowded (i.e., having more than one person per room) |
Census of Canada, 2001, 2006, 2011, 2016 |
| State of repair Percentage of dwellings in need of major repair |
Census of Canada, 2001, 2006, 2011, 2016 | |
| Health | Life expectancy Estimated life expectancy at age 1 |
Statistics Canada, 2006 and 2011 Canadian Census Health and Environment CohortFootnote 18 |
| Infant mortality rate The number of deaths of children under one year of age per 1000 live births |
2004-2006 Canadian Birth-Census Cohort databaseFootnote 19 | |
| Justice | Violent victimization Percentage of the population reporting having been the victim of physical or sexual assault since the age of 15 |
Survey of Safety in Public and Private Spaces, 2018Footnote 20 |
| Incarceration Custodial admissions as a percentage of the Indigenous and the non-Indigenous population and overrepresentation of Indigenous people in custodial admissions.Footnote 21 |
Adult Correctional Services survey, 2013/2014, 2014/2015, 2015/2016, 2016/2017, 2017/2018 |
Some notes on the approach and methodology
Limitations of the data
Data for the first five sets of indicators (from Income through Housing) are taken from the Census of Canada. This robust source of socioeconomic information remains the cornerstone of data because of its unparalleled ability to support distinctions-based, cross-time analyses for all of Canada, including reserves and the territories.Footnote 22
Despite its richness, the Census has some important limitations. For example, Indigenous people are classified in the Census as Indigenous or not based on self-identification, which can be imperfect given variations in how respondents interpret or understand the Indigenous identity questions, as well as their individual choices respecting whether and how to self-identify as an Indigenous person. In addition, the Census does not capture all First Nation communities. In 2016, there were a total of 14 First Nations communities that were not included, as enumeration was either not permitted, or interrupted before it could be completed. Another important limitation is that the Census of Canada includes a relatively narrow range of socioeconomic indicators, and does not capture the various other dimensions of well-being that are important from an Indigenous perspective.
As we move beyond the Census to seek other sources of data on health, justice, and infrastructure, the persistent gaps in data on Indigenous populations become more evident. In many cases, data are not available on all distinctions groups or geographies, or the data are older and not available across time. Where such limitations exist, the best data available are used to illustrate the gaps between Indigenous and non-Indigenous populations. A section at the end of this chapter is devoted to the gaps in Indigenous data, steps that have been taken to address them, and what further efforts can be made to ensure that all partners and stakeholders have the data required to support services to Indigenous peoples, and the transfer of services responsibilities to Indigenous control.
The analysis
To the extent possible, this analysis is distinctions-based and includes data for the past 15 years, to illustrate how socioeconomic gaps between Indigenous and non-Indigenous populations have evolved.
Data are presented for the three main distinctions groups: First Nations, Inuit, and Métis. First Nations data are further disaggregated, given the significant differences in socioeconomic outcomes that are known to exist among the following groups: Registered Indians living on reserve, Registered Indians living off reserve, and Non-Status Indians.
Regional and genderFootnote 23-based analyses are also provided. Notably, some very small populations of First Nations and Métis in the territories are also the populations experiencing the largest gaps relative to the non-Indigenous population. Because statistics based on very small populations are less reliable, and can create a skewed image of overall trends, one option would be to exclude them from broader analyses and/or discuss them separately. In the interest of transparency, however, it was decided to retain these small populations as part of the general analysis. Readers are encouraged to interpret statistics for small populations with caution, especially when data are further broken down by gender, age or other variables.Footnote 24
Findings
Income – median income
Median income is a well-established measure of material well-being. Although it does not capture an individual's assets, median income is one way of estimating a person's wealth.
Figure 3 below compares median income for the working age population (aged 25-64) across population groups. The gap in median income is largest for Registered Indians living on reserve, whose median income is less than half that of the non-Indigenous population. Registered Indians living off reserve, Non-Status Indians, and Inuit each have a median income that is between about 75% and 80% of the non-Indigenous population median income. Métis have a median income that is nearly on par with that of non-Indigenous Canadians.

Text alternative for Figure 3: Median income, 2015, Indigenous and non-Indigenous populations, aged 25-64, Canada
| Registered Indian on reserve | Registered Indian off reserve | Non-Status Indian | Inuit | Métis | Non-Indigenous | |
|---|---|---|---|---|---|---|
| Median income | $20,357 | $32,553 | $34,458 | $33,135 | $40,814 | $42,930 |
Figure 4 below shows how median incomeFootnote 25 has evolved over time. The most striking reduction in the income gap occurred among the Métis, though the gap also narrowed for Registered Indians living off reserve and Non-Status Indians. The median income gaps observed for Registered Indians living on reserve and Inuit, however, changed little.

Text alternative for Figure 4: Median income, 2005 – 2015, Indigenous and non-Indigenous populations, aged 25-64, Canada
| Registered Indian on reserve | Registered Indian off reserve | Non-Status Indian | Inuit | Métis | Non-Indigenous | |
|---|---|---|---|---|---|---|
| 2005 | $16,441 | $25,671 | $28,501 | $28,729 | $32,601 | $38,731 |
| 2010 | $16,905 | $30,021 | $32,286 | $31,767 | $37,482 | $41,225 |
| 2015 | $20,357 | $32,553 | $34,458 | $33,135 | $40,814 | $42,930 |
Region matters
The national picture of the median income gap between First Nations and the non-Indigenous population can conceal important regional differences. As Figure 5 illustrates, for example, Registered Indians living on reserve in Newfoundland and Labrador have a median income that is about 80% that of the non-Indigenous population, while Registered Indians living on reserve in Saskatchewan have a median income that is only 31% as large as that of Saskatchewan's non-Indigenous population – a difference of more than $34,000 annually.

Text alternative for Figure 5: Median income, 2015, First Nations and non-Indigenous populations, aged 25-64, by region
| Registered Indian on reserve | Registered Indian off reserve | Non-Status Indian | Non-Indigenous | |
|---|---|---|---|---|
| Newfoundland and Labrador | $33,088 | $36,853 | $37,310 | $41,263 |
| Prince Edward Island | $26,048 | $31,538 | $29,142 | $38,427 |
| Nova Scotia | $18,778 | $35,577 | $32,827 | $39,185 |
| New Brunswick | $22,209 | $31,807 | $29,024 | $38,064 |
| Quebec | $31,964 | $34,312 | $34,590 | $40,856 |
| Ontario | $22,708 | $32,708 | $32,643 | $42,564 |
| Manitoba | $15,973 | $28,061 | $33,972 | $43,286 |
| Saskatchewan | $15,367 | $30,980 | $34,016 | $49,418 |
| Alberta | $19,512 | $38,262 | $45,865 | $53,306 |
| British Columbia | $19,613 | $29,680 | $33,477 | $41,430 |
| Yukon | N/A | $39,625 | $52,538 | $58,757 |
| Northwest Territories | $27,072 | $38,555 | $61,362 | $82,965 |
| Nunavut | N/A | $83,456 | $92,416 | $106,569 |
Regional differences are less pronounced among Métis, whose median income ranges from 79% (in Nunavut) to 107% (in Newfoundland and Labrador) that of the non-Indigenous populations in those regions (Figure 6). It is worth noting that in Nunavut, where the most dramatic gap appears, only 140 people identified as Métis on the 2016 Census.

Text alternative for Figure 6: Median income, 2015, Métis and non-Indigenous populations, aged 25-64, by region
| Métis | Non-Indigenous | |
|---|---|---|
| Newfoundland and Labrador | $44,224 | $41,263 |
| Prince Edward Island | $35,866 | $38,427 |
| Nova Scotia | $37,640 | $39,185 |
| New Brunswick | $33,282 | $38,064 |
| Quebec | $36,373 | $40,856 |
| Ontario | $40,197 | $42,564 |
| Manitoba | $41,385 | $43,286 |
| Saskatchewan | $43,696 | $49,418 |
| Alberta | $47,419 | $53,306 |
| British Columbia | $37,487 | $41,430 |
| Yukon | $52,423 | $58,757 |
| Northwest Territories | $76,515 | $82,965 |
| Nunavut | $83,712 | $106,569 |
Figure 7 below illustrates the regional variations in the median income gap between Inuit and the non-Indigenous population. The gaps in each of the four regions of Inuit Nunangat are quite wide, with Inuit receiving between 28.3% (in Nunavut) and 49.8% (in Nunatsiavut) of what the non-Indigenous population receives. It is worth noting that these large gaps reflect the high median incomes of the non-Indigenous population living in Inuit Nunangat. Outside of Inuit Nunangat, the non-Indigenous population's median income is much lower, and the gap is comparatively narrow.

Text alternative for Figure 7: Median income, 2015, Inuit and non-Indigenous populations, aged 25-64, by region
| Nunatsiavut (Labrador) | Nunavik (Northern Quebec) | Inuvialuit Region (NWT and Yukon) | Nunavut | Outside of Inuit Nunangat | |
|---|---|---|---|---|---|
| Inuit | $31,792 | $35,524 | $31,424 | $30,190 | $36,116 |
| Non-Indigenous | $63,872 | $81,408 | $94,362 | $106,569 | $42,921 |
Gender mattersFootnote 26
For the non-Indigenous population in Canada, the median income for men is higher than the median income for women by approximately $13,500. As Figure 8 below illustrates, this pattern is different for Indigenous populations, particularly among Inuit, where men and women have a similar median income, and among Registered Indians living on reserve, where women's median income is more than $6,000 higher than that of men's. As a consequence, when one focused on data for men specifically, the gap in median income is particularly large: Registered Indian men living on reserve have a median income that is only about one third as large as the median income for non-Indigenous men; and Inuit men have a median income that is about two-thirds as large.

Text alternative for Figure 8: Median income, 2015, Indigenous and non-Indigenous populations, aged 25-64, by gender, Canada
| Registered Indian on reserve | Registered Indian off reserve | Non-Status Indian | Inuit | Métis | Non-Indigenous | |
|---|---|---|---|---|---|---|
| Male | $17,042 | $37,882 | $40,707 | $32,560 | $50,004 | $50,523 |
| Female | $23,296 | $29,602 | $30,180 | $33,434 | $34,509 | $36,997 |
Income – Low income measure
The low income measure is one way of assessing the level of poverty in a population. A person is considered to be living in a low income situation if they are part of a household whose total income (after tax) is less than half of the national median household income, adjusted for household size. The low income threshold in 2015 was $22,133 for a single person, and $44,266 for a family of four.Footnote 27
Figure 9 below compares the percentage of the population who were living in a low income situation in 2015.

Text alternative for Figure 9: Percentage living in a low income situation, 2015, Indigenous and non-Indigenous populations, Canada
| Registered Indian on reserve | Registered Indian off reserve | Non-Status Indian | Inuit | Métis | Non-Indigenous | |
|---|---|---|---|---|---|---|
| Percentage living in a low income situation | 47.7% | 30.3% | 25.2% | 22.3% | 17.3% | 13.8% |
Members of all Indigenous groups are more likely than the non-Indigenous population to be living in a situation of low income. Registered Indians living on reserve are 3.5 times more likely.
Figure 10 below illustrates that the likelihood of living in a low income situation decreased between 2005 and 2015 for each Indigenous group, particularly Registered Indians living off reserve. Since the likelihood for the non-Indigenous population stayed stable at around 14%, the gaps also narrowed for each Indigenous group – by as much as 6.6 percentage points for Registered Indians living off reserve.

Text alternative for Figure 10: Percentage living in a low income situation, 2005-2015, Indigenous and non-Indigenous populations, Canada
| Registered Indian on reserve | Registered Indian off reserve | Non-Status Indian | Inuit | Métis | Non-Indigenous | |
|---|---|---|---|---|---|---|
| 2005 | 50.7% | 36.7% | 27.5% | 26.3% | 21.0% | 13.6% |
| 2010 | 54.1% | 31.9% | 25.3% | 22.9% | 19.5% | 14.5% |
| 2015 | 47.7% | 30.3% | 25.2% | 22.3% | 17.3% | 13.8% |
Region matters
Once again, wide variation is evident across the provinces and territories with respect to the percentage of populations living in low income situations. Manitoba and Saskatchewan stand out as having the largest gaps between non-Indigenous and First Nations populations (Figure 11).

Text alternative for Figure 11: Percentage living in a low income situation, 2015, First Nations and non-Indigenous populations, by region
| Registered Indian on reserve | Registered Indian off reserve | Non-Status Indian | Non-Indigenous | |
|---|---|---|---|---|
| Newfoundland and Labrador | 14.1% | 17.5% | 18.3% | 15.3% |
| Prince Edward Island | 34.6% | 31.1% | 35.0% | 16.7% |
| Nova Scotia | 55.3% | 20.7% | 24.5% | 17.1% |
| New Brunswick | 47.8% | 26.4% | 33.7% | 16.8% |
| Quebec | 26.3% | 25.7% | 21.3% | 14.5% |
| Ontario | 43.1% | 27.4% | 26.2% | 14.2% |
| Manitoba | 59.6% | 44.1% | 38.9% | 13.1% |
| Saskatchewan | 59.5% | 39.6% | 37.5% | 10.7% |
| Alberta | 48.4% | 24.1% | 19.6% | 8.8% |
| British Columbia | 42.3% | 31.1% | 24.9% | 15.1% |
| Yukon | N/A | 24.5% | 19.1% | 7.4% |
| Northwest Territories | 19.3% | 20.2% | 19.4% | 4.3% |
| Nunavut | N/A | 11.8% | 12.5% | 2.4% |
With the exception of Newfoundland and Labrador, Métis in all regions are more likely than the non-Indigenous population to be in a low income situation: ranging from a difference of only about one percentage point in Nova Scotia, to seven percentage points in Saskatchewan (Figure 12).

Text alternative for Figure 12: Percentage living in a low income situation, 2015, Métis and non-Indigenous populations, by region
| Métis | Non-Indigenous | |
|---|---|---|
| Newfoundland and Labrador | 12.6% | 15.3% |
| Prince Edward Island | 20.6% | 16.7% |
| Nova Scotia | 18.2% | 17.1% |
| New Brunswick | 23.7% | 16.8% |
| Quebec | 19.8% | 14.5% |
| Ontario | 17.8% | 14.2% |
| Manitoba | 18.3% | 13.1% |
| Saskatchewan | 17.7% | 10.7% |
| Alberta | 13.3% | 8.8% |
| British Columbia | 18.3% | 15.1% |
| Yukon | 11.3% | 7.4% |
| Northwest Territories | 8.6% | 4.3% |
| Nunavut | 7.1% | 2.4% |
As Figure 13 illustrates, the low income gap between Inuit and the non-Indigenous population outside Inuit Nunangat is similar to the national gap that was shown in Figure 9. The gaps are much higher in the four Inuit regions, however, where the percentage of Inuit in a low income situation exceeds that of the non-Indigenous population by between 12.6 (in Nunavik) 23.6 (in Nunavut) percentage points.

Text alternative for Figure 13: Percentage living in a low income situation, 2015, Inuit and non-Indigenous populations, by region
| Nunatsiavut (Labrador) | Nunavik (Northern Quebec) | Inuvialuit Region (NWT and Yukon) | Nunavut | Outside of Inuit Nunangat | |
|---|---|---|---|---|---|
| Inuit | 22.5% | 14.4% | 24.0% | 26.0% | 20.8% |
| Non-Indigenous | 4.8% | 1.8% | 7.0% | 2.4% | 13.8% |
A focus on gender
Figure 14 illustrates that, although there is a greater tendency to be living in a low income situation among women than among men, differences are relatively small. Consequently, the gaps between Indigenous and non-Indigenous males do not differ in a marked or consistent way from the gaps between Indigenous and non-Indigenous females.

Text alternative for Figure 14: Percentage living in a low income situation, 2015, Indigenous and non-Indigenous populations, by gender, Canada
| Registered Indian on reserve | Registered Indian off reserve | Non-Status Indian | Inuit | Métis | Non-Indigenous | |
|---|---|---|---|---|---|---|
| Male | 47.7% | 28.4% | 24.3% | 22.1% | 16.0% | 13.1% |
| Female | 47.7% | 31.9% | 26.1% | 22.5% | 18.5% | 14.5% |
Employment – employment rate
Employment rate is one way of measuring a population's economic health, and is simply the percentage of the working age population (aged 25-64) who have a job.
Figure 15 demonstrates that all Indigenous populations – particularly Registered Indians living on reserve – have lower employment rates than the non-Indigenous population.

Text alternative for Figure 15: Employment rate, 2016, Indigenous and non-Indigenous populations, aged 25-64, Canada
| Registered Indian on reserve | Registered Indian off reserve | Non-Status Indian | Inuit | Métis | Non-Indigenous | |
|---|---|---|---|---|---|---|
| Employment rate | 46.9% | 60.2% | 66.1% | 57.4% | 70.4% | 76.0% |
Figure 16 below demonstrates that employment rates have been relatively stable over time. The gaps relative to the non-Indigenous population narrowed slightly for Registered Indians living off reserve, Non-Status Indians, and Métis, but increased slightly for Registered Indians living on reserve and Inuit.

Text alternative for Figure 16: Employment rate, 2001 – 2016, Indigenous and non-Indigenous populations, aged 25-64, Canada
| Registered Indian on reserve | Registered Indian off reserve | Non-Status Indian | Inuit | Métis | Non-Indigenous | |
|---|---|---|---|---|---|---|
| 2001 | 48.1% | 56.4% | 63.3% | 59.0% | 67.9% | 75.1% |
| 2006 | 50.2% | 61.8% | 67.4% | 59.7% | 71.5% | 76.3% |
| 2011 | 46.8% | 61.2% | 67.0% | 58.6% | 71.6% | 75.8% |
| 2016 | 46.9% | 60.2% | 66.1% | 57.4% | 70.4% | 76.0% |
Region matters
Employment rates for First Nations vary widely across the provinces and territories. Manitoba, Saskatchewan and Northwest Territories stand out as having the largest gaps between non-Indigenous and First Nations populations (Figure 17). In Saskatchewan, for example, the gaps are 42.7, 27.0, and 21.6 percentage points wide for Registered Indians on reserve, Registered Indians off reserve, and Non-Status Indians, respectively.

Text alternative for Figure 17: Employment rate, 2016, First Nations and non-Indigenous populations, aged 25-64, by region
| Registered Indian on reserve | Registered Indian off reserve | Non-Status Indian | Non-Indigenous | |
|---|---|---|---|---|
| Newfoundland and Labrador | 50.2% | 60.8% | 61.1% | 64.9% |
| Prince Edward Island | 50.0% | 61.3% | 61.3% | 74.5% |
| Nova Scotia | 47.8% | 67.2% | 64.9% | 72.0% |
| New Brunswick | 46.3% | 62.2% | 58.5% | 71.3% |
| Quebec | 55.2% | 63.3% | 68.6% | 75.7% |
| Ontario | 52.7% | 62.3% | 64.5% | 76.0% |
| Manitoba | 40.0% | 52.4% | 64.8% | 79.6% |
| Saskatchewan | 38.0% | 53.7% | 59.1% | 80.7% |
| Alberta | 43.6% | 62.4% | 69.5% | 77.7% |
| British Columbia | 51.9% | 61.5% | 69.3% | 75.8% |
| Yukon | N/A | 58.7% | 77.5% | 83.5% |
| Northwest Territories | 51.9% | 59.3% | 66.7% | 87.7% |
| Nunavut | N/A | 85.7% | 81.8% | 92.2% |
As shown in Figure 18, the employment rate gap for Métis is up to ten percentage points wide in some regions (New Brunswick, Quebec, and Saskatchewan), and in other regions, however, the gap is very small. In Prince Edward Island, the employment rate for Métis is actually slightly higher than that of the non-Indigenous population.

Text alternative for Figure 18: Employment rate, 2016, Métis and non-Indigenous populations, aged 25-64, by region
| Métis | Non-Indigenous | |
|---|---|---|
| Newfoundland and Labrador | 56.9% | 64.9% |
| Prince Edward Island | 75.8% | 74.5% |
| Nova Scotia | 71.3% | 72.0% |
| New Brunswick | 61.3% | 71.3% |
| Quebec | 65.9% | 75.7% |
| Ontario | 69.8% | 76.0% |
| Manitoba | 73.7% | 79.6% |
| Saskatchewan | 71.6% | 80.7% |
| Alberta | 71.0% | 77.7% |
| British Columbia | 71.7% | 75.8% |
| Yukon | 80.2% | 83.5% |
| Northwest Territories | 80.3% | 87.7% |
| Nunavut | 85.7% | 92.2% |
Figure 19 illustrates that the employment rate gaps for Inuit are smallest – at 15.5 percentage points wide – outside Inuit Nunangat. Inside Inuit Nunangat, the smallest gap is in Inuvialuit Settlement Region (29.1 percentage points), and the largest in Nunavut (38.5 percentage points).

Text alternative for Figure 19: Employment rate, 2016, Inuit and non-Indigenous populations, aged 25-64, by region
| Nunatsiavut (Labrador) | Nunavik (Northern Quebec) | Inuvialuit Region (NWT and Yukon) | Nunavut | Outside of Inuit Nunangat | |
|---|---|---|---|---|---|
| Inuit | 48.2% | 63.7% | 58.8% | 53.7% | 60.5% |
| Non-Indigenous | 77.4% | 94.6% | 87.9% | 92.2% | 76.0% |
A focus on gender
The employment rate gap between Indigenous and non-Indigenous populations is larger among males than among females. For example, while the gap between female Registered Indians living on reserve and non-Indigenous females was 23.9 percentage points wide, the gap when similarly compared among males, was 34.5 percentage points wide (Figure 20).

Text alternative for Figure 20: Employment rate, 2016, Indigenous and non-Indigenous populations, aged 25-64, by gender, Canada
| Registered Indian on reserve | Registered Indian off reserve | Non-Status Indian | Inuit | Métis | Non-Indigenous | |
|---|---|---|---|---|---|---|
| Male | 45.5% | 63.8% | 68.9% | 56.9% | 72.6% | 80.0% |
| Female | 48.2% | 57.3% | 63.7% | 57.8% | 68.4% | 72.1% |
Employment – employment income
Median employment income complements employment rate, as it is a common way of assessing the quality of jobs held by the employed population.
Figure 21 illustrates substantial gaps in median employment income between the non-Indigenous population and First Nations and Inuit.

Text alternative for Figure 21: Median employment income, 2015, Indigenous and non-Indigenous populations, aged 25-64, Canada
| Registered Indian on reserve | Registered Indian off reserve | Non-Status Indian | Inuit | Métis | Non-Indigenous | |
|---|---|---|---|---|---|---|
| Median employment income | $23,298 | $35,390 | $36,457 | $32,673 | $41,440 | $42,660 |
Figure 22 below shows how median employment income (adjusted to account for inflation) has evolved over time. Although median employment income has increased for each group, the gap relative to the non-Indigenous population has decreased for Registered Indians living off reserve, Non-Status Indians, and Métis only. The median employment income gaps for Inuit and Registered Indians living on reserve have changed little.

Text alternative for Figure 22: Median employment income, 2005 – 2015, Indigenous and non-Indigenous populations, aged 25-64, Canada
| Registered Indian on reserve | Registered Indian off reserve | Non-Status Indian | Inuit | Métis | Non-Indigenous | |
|---|---|---|---|---|---|---|
| 2005 | $20,954 | $29,650 | $32,156 | $30,336 | $34,762 | $40,137 |
| 2010 | $24,509 | $35,282 | $35,959 | $32,866 | $39,910 | $42,974 |
| 2015 | $23,298 | $35,390 | $36,457 | $32,673 | $41,440 | $42,660 |
Region matters
The national median employment income gaps can conceal important regional differences. As Figure 23 illustrates, for example, Registered Indians living on reserve in Quebec have a median employment income that is about 74% that of the non-Indigenous population, whereas Registered Indians living on reserve in Saskatchewan and New Brunswick have a median income that are only 44% as large as that of the non-Indigenous population in those provinces – differences of $26,172 and $20,485, respectively. The largest gap for First Nations is for the small group of approximately 130 Registered Indians living on reserve in the Northwest Territories, at more than $59,000.

Text alternative for Figure 23: Median employment income, 2015, First Nations and non-Indigenous populations, aged 25-64, by region
| Registered Indian on reserve | Registered Indian off reserve | Non-Status Indian | Non-Indigenous | |
|---|---|---|---|---|
| Newfoundland and Labrador | $20,928 | $36,409 | $37,668 | $40,816 |
| Prince Edward Island | $16,960 | $26,755 | $27,301 | $34,927 |
| Nova Scotia | $23,509 | $35,178 | $33,450 | $37,979 |
| New Brunswick | $16,374 | $28,722 | $29,651 | $36,859 |
| Quebec | $28,605 | $33,960 | $33,718 | $38,744 |
| Ontario | $25,567 | $37,774 | $36,388 | $43,879 |
| Manitoba | $20,137 | $30,940 | $34,229 | $42,332 |
| Saskatchewan | $20,964 | $32,517 | $38,670 | $47,136 |
| Alberta | $23,910 | $42,185 | $48,350 | $52,838 |
| British Columbia | $22,624 | $32,363 | $35,395 | $41,574 |
| Yukon | N/A | $40,295 | $52,582 | $56,389 |
| Northwest Territories | $22,080 | $40,463 | $71,680 | $81,106 |
| Nunavut | N/A | $77,312 | $82,176 | $104,294 |
As Figure 24 illustrates, the small employment income gap that is seen for Métis at the national level is similarly small in most regions. New Brunswick and NunavutFootnote 28 are exceptions, where median employment incomes for Métis are 80% and 81% that of the non-Indigenous population in those regions, respectively. By contrast, the median income of the approximately 6,625 Métis in Newfoundland and Labrador is more than $3,000 higher than that of the non-Indigenous population in the province.

Text alternative for Figure 24: Median employment income, 2015, Métis and non-Indigenous populations, aged 25-64, by region
| Métis | Non-Indigenous | |
|---|---|---|
| Newfoundland and Labrador | $44,107 | $40,816 |
| Prince Edward Island | $31,998 | $34,927 |
| Nova Scotia | $34,810 | $37,979 |
| New Brunswick | $29,406 | $36,859 |
| Quebec | $34,746 | $38,744 |
| Ontario | $42,299 | $43,879 |
| Manitoba | $41,929 | $42,332 |
| Saskatchewan | $44,594 | $47,136 |
| Alberta | $48,658 | $52,838 |
| British Columbia | $38,104 | $41,574 |
| Yukon | $55,724 | $56,389 |
| Northwest Territories | $77,381 | $81,106 |
| Nunavut | $84,736 | $104,294 |
Figure 25 shows that, outside Inuit Nunangat, the employment income gap for Inuit is relatively narrow, with Inuit earning 91% of the employment income earned by the non-Indigenous population. Within Inuit Nunangat, however, the median employment income for Inuit is between about one half (in Nunatsiavut) and one third (in Nunavut) that of the non-Indigenous population.

Text alternative for Figure 25: Median employment income, 2015, Inuit and non-Indigenous populations, aged 25-64, by region
| Nunatsiavut (Labrador) | Nunavik (Northern Quebec) | Inuvialuit Region (NWT and Yukon) | Nunavut | Outside of Inuit Nunangat | |
|---|---|---|---|---|---|
| Inuit | $30,272 | $28,565 | $30,304 | $30,039 | $38,707 |
| Non-Indigenous | $58,368 | $79,680 | $94,400 | $104,294 | $42,650 |
A focus on gender
Figure 26 illustrates that, Métis excepted, the gap in median employment income between Indigenous and non-Indigenous populations is larger among males than among females. For example, female Registered Indians living on reserve earned 67% of the employment income earned by non-Indigenous women (a difference of $11,881). By contrast, Registered Indian males living on reserve earned 44% of the employment income earned by non-Indigenous males (a difference of $28,529).

Text alternative for Figure 26: Median employment income, 2015, Indigenous and non-Indigenous Populations, aged 25-64, by gender, Canada
| Registered Indian on reserve | Registered Indian off reserve | Non-Status Indian | Inuit | Métis | Non-Indigenous | |
|---|---|---|---|---|---|---|
| Male | $22,218 | $42,838 | $44,498 | $34,344 | $51,282 | $50,747 |
| Female | $24,205 | $30,034 | $30,165 | $31,097 | $34,002 | $36,086 |
Education – having at least a high school credential
In addition to being a baseline requirement for many careers, completing a formal education at the high school level or above has the added benefit of ensuring that individuals have the literacy, numeracy, and other skills they need to participate fully in Canada's economy and in civil society, and to effectively access the services and benefits to which they are entitled.
Figure 27 demonstrates that significant gaps in high school completionFootnote 29 exist between Indigenous populations – particularly First Nations living on reserve and Inuit – and the non-Indigenous population in Canada.

Text alternative for Figure 27: Percentage with at least a high school credential, 2016, Indigenous and non-Indigenous populations, aged 25-64, Canada
| Registered Indian on reserve | Registered Indian off reserve | Non-Status Indian | Inuit | Métis | Non-Indigenous | |
|---|---|---|---|---|---|---|
| Percentage with at least a high school credential | 57.0% | 75.0% | 80.3% | 55.9% | 82.3% | 89.2% |
Figure 28 illustrates that levels of high school completion have increased slowly over time for all Indigenous groups, as well as for the non-Indigenous population. The gaps narrowed somewhat for Non-Status Indians and Métis, were unchanged for Registered Indians living off reserve, and widened about six and seven percentage points for Registered Indians living on reserve and Inuit, respectively.

Text alternative for Figure 28: Percentage with at least a high school credential, 2001 – 2016, Indigenous and non-Indigenous populations, aged 25-64, Canada
| Registered Indian on reserve | Registered Indian off reserve | Non-Status Indian | Inuit | Métis | Non-Indigenous | |
|---|---|---|---|---|---|---|
| 2001 | 51.3% | 63.6% | 65.9% | 51.8% | 66.7% | 77.7% |
| 2006 | 50.0% | 68.0% | 71.5% | 48.6% | 74.4% | 85.2% |
| 2011 | 53.5% | 72.9% | 77.7% | 51.5% | 79.6% | 87.9% |
| 2016 | 57.0% | 75.0% | 80.3% | 55.9% | 82.3% | 89.2% |
Region matters
High school completion varies widely across the provinces and territories. The Prairie provinces and the Northwest Territories stand out as having the largest gaps between non-Indigenous and First Nations populations (Figure 29).

Text alternative for Figure 29: Percentage with at least a high school credential, 2016, First Nations and non-Indigenous populations, aged 25-64, by region
| Registered Indian on reserve | Registered Indian off reserve | Non-Status Indian | Non-Indigenous | |
|---|---|---|---|---|
| Newfoundland and Labrador | 52.8% | 83.4% | 85.2% | 84.6% |
| Prince Edward Island | 65.4% | 90.7% | 77.0% | 88.1% |
| Nova Scotia | 73.8% | 85.1% | 87.2% | 88.0% |
| New Brunswick | 74.3% | 82.0% | 80.5% | 86.4% |
| Quebec | 56.9% | 76.9% | 79.0% | 87.0% |
| Ontario | 60.6% | 79.2% | 80.5% | 89.9% |
| Manitoba | 46.1% | 67.7% | 75.0% | 88.8% |
| Saskatchewan | 54.1% | 73.1% | 73.8% | 90.5% |
| Alberta | 52.4% | 72.7% | 77.6% | 90.1% |
| British Columbia | 65.4% | 74.6% | 80.5% | 91.1% |
| Yukon | N/A | 72.6% | 91.0% | 92.6% |
| Northwest Territories | 50.0% | 57.5% | 71.7% | 93.7% |
| Nunavut | N/A | 90.5% | 81.8% | 96.1% |
Regional variation in high school attainment is modest among Métis, and the gaps relative to the non-Indigenous population range from a low of one percentage point in Prince Edward Island to a high of almost 14 percentage points in the Northwest Territories (Figure 30).

Text alternative for Figure 30: Percentage with at least a high school credential, 2016, Métis and non-Indigenous populations, aged 25-64, by region
| Métis | Non-Indigenous | |
|---|---|---|
| Newfoundland and Labrador | 82.5% | 84.6% |
| Prince Edward Island | 87.1% | 88.1% |
| Nova Scotia | 84.7% | 88.0% |
| New Brunswick | 78.0% | 86.4% |
| Quebec | 81.0% | 87.0% |
| Ontario | 86.1% | 89.9% |
| Manitoba | 80.2% | 88.8% |
| Saskatchewan | 81.3% | 90.5% |
| Alberta | 79.8% | 90.1% |
| British Columbia | 84.2% | 91.1% |
| Yukon | 87.3% | 92.6% |
| Northwest Territories | 80.0% | 93.7% |
| Nunavut | 85.0% | 96.1% |
Figure 31 illustrates that, outside Inuit Nunangat, the high school completion gap for Inuit is comparatively small: the rate of high school completion for the non-Indigenous population exceeds that of Inuit by 12 percentage points. Within Inuit Nunangat, however, the gaps range from 30 (in Nunatsiavut) to 56 (in Nunavik) percentage points wide.

Text alternative for Figure 31: Percentage with at least a high school credential, Inuit and non-Indigenous populations, aged 25-64, by region
| Nunatsiavut (Labrador) | Nunavik (Northern Quebec) | Inuvialuit Region (NWT and Yukon) | Nunavut | Outside of Inuit Nunangat | |
|---|---|---|---|---|---|
| Inuit | 63.2% | 41.0% | 53.4% | 47.0% | 76.7% |
| Non-Indigenous | 93.3% | 96.7% | 94.5% | 95.8% | 89.2% |
Changes in a population's education levels tend to start with youth. As the availability of and need for formal education expands, young people strive to obtain the credentials they need to achieve their career goals. Although older adults can and do obtain additional educational credentials, most people complete their formal education when they are relatively younger. According to the 2016 Census, for example, while 64% of Indigenous people aged 15-24 who did not already have a high school diploma were enrolled in school, only 2% of those over 45 were enrolled. Looking at the educational attainment of younger cohorts, therefore, can provide some insight into how the overall education gap can be expected to change in the future. Simply put, if the gaps are smaller among younger cohorts, the overall gaps are in the process of narrowing.
As Figure 32 demonstrates, the gaps among the younger cohort are actually slightly larger than the gaps among the older cohort, suggesting that the high school completion gaps between Indigenous and non-Indigenous populations are not on track to narrow in the short term.
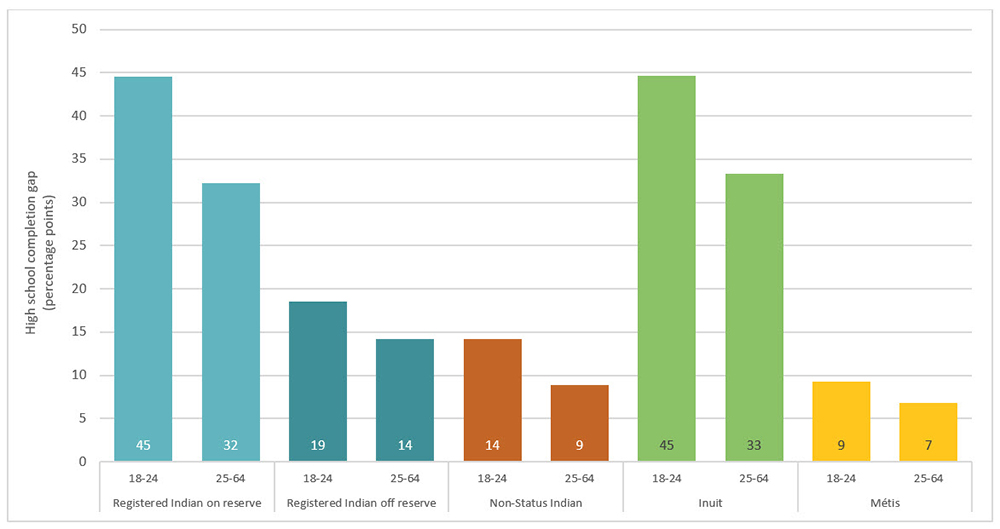
Text alternative for Figure 32: High school completion gap (in percentage points) between Indigenous and non-Indigenous populations, aged 18-24 and 25-64, 2016, Canada
| Registered Indian on reserve | Registered Indian off reserve | Non-Status Indian | Inuit | Métis | |
|---|---|---|---|---|---|
| Aged 18-24 | 45 | 19 | 14 | 45 | 9 |
| Aged 25-64 | 32 | 14 | 9 | 33 | 7 |
A focus on gender
Unlike other socioeconomic indicators like income and employment, women tend to have higher levels of educational attainment than men. Figure 33 demonstrates that high school completion gaps between Indigenous and non-Indigenous populations tend to be larger among males than among females. For example, among Registered Indians living on reserve, the high school completion gap relative to the non-Indigenous population is 34.9 percentage points wide for males, but 29.5 percentage points wide for females.

Text alternative for Figure 33: Percentage with at least a high school credential, 2016, Indigenous and non-Indigenous populations, aged 25-64, by gender, Canada
| Registered Indian on reserve | Registered Indian off reserve | Non-Status Indian | Inuit | Métis | Non-Indigenous | |
|---|---|---|---|---|---|---|
| Male | 52.9% | 72.4% | 76.9% | 54.8% | 79.1% | 87.7% |
| Female | 61.0% | 77.2% | 83.3% | 56.8% | 85.3% | 90.6% |
Education – completion of a university degree
Although not everyone wants or needs a university degree to fulfil their career goals, those with a university degree still have the highest incomes in Canada, and a degree can generally expand one's employment options as well as providing advanced skills that can be assets in various domains of life.
Figure 34 below illustrates the significant gaps in university attainment that exist for all Indigenous groups, most notably First Nations living on reserve and Inuit, who are less than one-fifth as likely as the non-Indigenous population to have a university degree.

Text alternative for Figure 34: Percentage with a university degree, 2016, Indigenous and non-Indigenous populations, aged 25-64, Canada
| Registered Indian on reserve | Registered Indian off reserve | Non-Status Indian | Inuit | Métis | Non-Indigenous | |
|---|---|---|---|---|---|---|
| Percentage with a university degree | 5.4% | 11.3% | 11.9% | 5.3% | 13.6% | 29.3% |
Figure 35 demonstrates that the university gap in the working age population (aged 25-64) has been widening for all Indigenous groups relative to the non-Indigenous population. Although First Nations, Inuit, and Métis all saw increases in university attainment between 2001 and 2016, none increased quickly enough to keep pace with the non-Indigenous population. Moreover, as Figure 36 illustrates, the gaps are wider among younger people (aged 25-34), suggesting that disparities in university completion are not poised to improve in the short term.

Text alternative for Figure 35: Percentage with a university degree, 2001 – 2016, Indigenous and non-Indigenous populations, aged 25-64, Canada
| Registered Indian on reserve | Registered Indian off reserve | Non-Status Indian | Inuit | Métis | Non-Indigenous | |
|---|---|---|---|---|---|---|
| 2001 | 3.4% | 6.8% | 7.0% | 2.5% | 7.2% | 20.1% |
| 2006 | 4.4% | 9.0% | 7.9% | 3.7% | 9.2% | 23.4% |
| 2011 | 4.7% | 11.0% | 10.7% | 5.1% | 12.1% | 26.5% |
| 2016 | 5.4% | 11.3% | 11.9% | 5.3% | 13.6% | 29.3% |

Text alternative for Figure 36: University completion gap (in percentage points) between Indigenous and non-Indigenous populations, aged 25-34 and 25-64, 2016, Canada
| Registered Indian on reserve | Registered Indian off reserve | Non-Status Indian | Inuit | Métis | |
|---|---|---|---|---|---|
| Aged 25-34 | 34 | 25 | 22 | 32 | 19 |
| Aged 25-64 | 24 | 18 | 17 | 24 | 16 |
Region matters
Figure 37 illustrates the marked variations in university completion gaps for First Nations across regions. The gaps tend to be less pronounced in the Atlantic provinces, where university completion among the non-Indigenous population is lower. Figure 38 shows a similar pattern among Métis.

Text alternative for Figure 37: Percentage with a university degree, 2016, First Nations and non-Indigenous populations, aged 25-64, by region
| Registered Indian on reserve | Registered Indian off reserve | Non-Status Indian | Non-Indigenous | |
|---|---|---|---|---|
| Newfoundland and Labrador | 3.8% | 14.1% | 16.8% | 18.8% |
| Prince Edward Island | 5.8% | 22.7% | 9.8% | 23.9% |
| Nova Scotia | 15.1% | 19.2% | 14.9% | 25.9% |
| New Brunswick | 8.2% | 15.1% | 10.4% | 20.5% |
| Quebec | 5.7% | 13.0% | 11.4% | 25.9% |
| Ontario | 5.2% | 12.7% | 11.7% | 32.4% |
| Manitoba | 5.2% | 9.6% | 9.7% | 28.0% |
| Saskatchewan | 5.1% | 11.8% | 10.5% | 24.5% |
| Alberta | 4.1% | 9.5% | 11.2% | 29.2% |
| British Columbia | 5.0% | 10.0% | 11.3% | 31.0% |
| Yukon | N/A | 9.3% | 15.7% | 35.3% |
| Northwest Territories | 0.0% | 5.2% | 8.3% | 38.2% |
| Nunavut | N/A | 23.8% | 36.4% | 50.6% |

Text alternative for Figure 38: Percentage with a university degree, 2016, Métis and Non-Indigenous populations, aged 25-64, by region
| Métis | Non-Indigenous | |
|---|---|---|
| Newfoundland and Labrador | 12.1% | 18.8% |
| Prince Edward Island | 19.4% | 23.9% |
| Nova Scotia | 17.9% | 25.9% |
| New Brunswick | 10.3% | 20.5% |
| Quebec | 13.7% | 25.9% |
| Ontario | 16.0% | 32.4% |
| Manitoba | 12.8% | 28.0% |
| Saskatchewan | 12.9% | 24.5% |
| Alberta | 12.0% | 29.2% |
| British Columbia | 13.0% | 31.0% |
| Yukon | 16.7% | 35.3% |
| Northwest Territories | 17.1% | 38.2% |
| Nunavut | 35.0% | 50.6% |
Figure 39 demonstrates the very large gaps in university completion that exist between Inuit and the non-Indigenous population, even outside of Inuit Nunangat. Within Inuit Nunangat, almost half of the non-Indigenous population in each region has a university degree, compared to only a very small percentage of Inuit.

Text alternative for Figure 39: Percentage with a university degree, 2016, Inuit and non-Indigenous populations, aged 25-64, by region
| Nunatsiavut (Labrador) | Nunavik (Northern Quebec) | Inuvialuit Region (NWT and Yukon) | Nunavut | Outside of Inuit Nunangat | |
|---|---|---|---|---|---|
| Inuit | 4.0% | 1.1% | 3.0% | 2.6% | 12.0% |
| Non-Indigenous | 46.7% | 48.9% | 47.9% | 50.5% | 29.3% |
A focus on gender
As Figure 40 demonstrates, the university completion gaps between Indigenous and non-Indigenous populations are similar for males and females.

Text alternative for Figure 40: Percentage with a university degree, 2016, Indigenous and non-Indigenous populations, aged 25-64, by gender, Canada
| Registered Indian on reserve | Registered Indian off reserve | Non-Status Indian | Inuit | Métis | Non-Indigenous | |
|---|---|---|---|---|---|---|
| Male | 2.9% | 8.0% | 9.0% | 3.4% | 10.7% | 26.9% |
| Female | 7.8% | 14.1% | 14.4% | 7.0% | 16.3% | 31.7% |
Housing – crowding
The World Health Organization identified overcrowding as a major factor in the transmission of diseasesFootnote 30,Footnote 31, and it has been linked to other adverse outcomes such as behavioural issues among children.Footnote 32 While the likelihood that one will live in a crowded dwelling is largely a function of one's income or wealth, it is also impacted by the availability of housing and other aspects of local housing markets, and therefore should be measured separately.
Figure 41 below illustrates that crowdedFootnote 33 dwellings are rare in the non-Indigenous population, even though, as seen above, 13.8% of that population is living in a low income situation. Crowded dwellings are similarly rare among Registered Indians living off reserve, Non-Status Indians, and Métis. By contrast, the crowding gaps measured for Registered Indians living on reserve and Inuit are substantial, and, as Figure 42 illustrates, have changed little since 2001.

Text alternative for Figure 41: Percentage of dwellings classified as crowded, 2016, Indigenous and non-Indigenous populations, Canada
| Registered Indian on reserve | Registered Indian off reserve | Non-Status Indian | Inuit | Métis | Non-Indigenous | |
|---|---|---|---|---|---|---|
| Percentage of dwellings classified as crowded | 12.7% | 2.7% | 1.1% | 16.0% | 0.8% | 1.8% |

Text alternative for Figure 42: Percentage of dwellings classified as crowded, 2001 – 2016, Indigenous and non-Indigenous populations, Canada
| Registered Indian on reserve | Registered Indian off reserve | Non-Status Indian | Inuit | Métis | Non-Indigenous | |
|---|---|---|---|---|---|---|
| 2001 | 13.8% | 3.8% | 1.3% | 15.3% | 1.5% | 1.3% |
| 2006 | 12.6% | 3.4% | 1.3% | 16.3% | 1.2% | 1.4% |
| 2011 | 13.1% | 3.4% | 1.4% | 15.6% | 1.3% | 1.9% |
| 2016 | 12.7% | 2.7% | 1.1% | 16.0% | 0.8% | 1.8% |
Region matters
As Figure 43 illustrates, crowding among First Nations is overwhelmingly an issue for those living on reserve, particularly in the Prairie provinces, although Registered Indians living off reserve experience crowding gaps relative to the non-Indigenous populations in Manitoba, Saskatchewan, and the Northwest Territories.

Text alternative for Figure 43: Percentage of dwellings classified as crowded, 2016, First Nations and non-Indigenous populations, by region
| Registered Indian on reserve | Registered Indian off reserve | Non-Status Indian | Non-Indigenous | |
|---|---|---|---|---|
| Newfoundland and Labrador | 14.5% | 0.5% | 0.3% | 0.3% |
| Prince Edward Island | 0.0% | 0.0% | 2.8% | 0.5% |
| Nova Scotia | 4.5% | 0.2% | 0.9% | 0.5% |
| New Brunswick | 2.3% | 1.4% | 1.4% | 0.5% |
| Quebec | 10.6% | 0.8% | 0.6% | 1.1% |
| Ontario | 8.3% | 1.4% | 1.0% | 2.4% |
| Manitoba | 23.1% | 5.1% | 1.8% | 2.5% |
| Saskatchewan | 18.9% | 5.7% | 3.0% | 1.5% |
| Alberta | 17.6% | 3.3% | 1.2% | 2.0% |
| British Columbia | 4.8% | 2.8% | 1.5% | 2.2% |
| Yukon | N/A | 1.7% | 0.0% | 1.6% |
| Northwest Territories | 11.8% | 9.9% | 0.0% | 2.5% |
| Nunavut | N/A | 0.0% | 0.0% | 1.6% |
Figure 44 illustrates that, while the percentage of dwellings classified as crowded is slightly higher among Métis than among the non-Indigenous population in some regions (e.g., Newfoundland and Labrador, and the Yukon), the opposite is true in other regions (e.g., Quebec, Ontario, Manitoba, Alberta, British Columbia, and the Northwest Territories). Overall, the crowding gaps between Métis and the non-Indigenous population are very small across the country.

Text alternative for Figure 44: Percentage of dwellings classified as crowded, 2016, Métis and non-Indigenous populations, by region
| Métis | Non-Indigenous | |
|---|---|---|
| Newfoundland and Labrador | 0.8% | 0.3% |
| Prince Edward Island | 0.0% | 0.5% |
| Nova Scotia | 0.5% | 0.5% |
| New Brunswick | 0.5% | 0.5% |
| Quebec | 0.4% | 1.1% |
| Ontario | 0.6% | 2.4% |
| Manitoba | 0.8% | 2.5% |
| Saskatchewan | 1.4% | 1.5% |
| Alberta | 1.2% | 2.0% |
| British Columbia | 1.0% | 2.2% |
| Yukon | 2.0% | 1.6% |
| Northwest Territories | 1.3% | 2.5% |
| Nunavut | 0.0% | 1.6% |
As shown in Figure 45, outside Inuit Nunangat, crowded dwellings are similarly rare for Inuit and the non-Indigenous population. Inside Inuit Nunangat, while crowded dwellings are still rare among the non-Indigenous population, more than a quarter of Inuit households are crowded in Nunavut (28.6%) and Nunavik (27.2%), with significant crowding among Inuit dwellings in Nunatsiavut (8.2%) and Inuvialuit (6.6%) as well.

Text alternative for Figure 45: Percentage of dwellings classified as crowded, 2016, Inuit and non-Indigenous populations, by region
| Nunatsiavut (Labrador) | Nunavik (Northern Quebec) | Inuvialuit Region (NWT and Yukon) | Nunavut | Outside of Inuit Nunangat | |
|---|---|---|---|---|---|
| Inuit | 8.2% | 27.2% | 6.6% | 28.6% | 1.3% |
| Non-Indigenous | 0.0% | 1.7% | 2.0% | 1.9% | 1.8% |
Housing – dwellings in need of major repair
Similar to living in a crowded home, living in a home that is in need of major repair can have adverse impacts on well-being, both directly (e.g., if mold is present) or indirectly (e.g., by creating financial or mental stress, being disruptive, or depriving people of the household facilities on which they dependFootnote 34).
Figure 46 illustrates that there is a significant housing repair gap between Indigenous and the non-Indigenous population, with the largest gaps being evident among Registered Indians living on reserve and Inuit.

Text alternative for Figure 46: Percentage of dwellings in need of major repair,2016, Indigenous and non-Indigenous populations, Canada
| Registered Indian on reserve | Registered Indian off reserve | Non-Status Indian | Inuit | Métis | Non-Indigenous | |
|---|---|---|---|---|---|---|
| Percentage of dwellings in need of major repair | 40.0% | 12.2% | 12.3% | 21.8% | 10.3% | 6.0% |
As Figure 47 illustrates, the percentage of dwellings in need of major repair decreased for the non-Indigenous population, Registered Indians living off reserve, Non-Status Indians, and Métis. Moreover, the gaps between these Indigenous groups and the non-Indigenous population narrowed slightly. By contrast, the percentage of dwellings in need of major repair rose for Registered Indians living on reserve and Inuit, and their gaps relative to the non-Indigenous population widened slightly.

Text alternative for Figure 47: Percentage of dwellings in need of major repair,2001 – 2016, Indigenous and non-Indigenous populations, Canada
| Registered Indian on reserve | Registered Indian off reserve | Non-Status Indian | Inuit | Métis | Non-Indigenous | |
|---|---|---|---|---|---|---|
| 2001 | 36.9% | 16.2% | 17.3% | 20.1% | 14.9% | 7.8% |
| 2006 | 42.2% | 15.4% | 14.5% | 22.4% | 12.5% | 7.0% |
| 2011 | 39.7% | 14.4% | 13.2% | 25.1% | 12.1% | 6.9% |
| 2016 | 40.0% | 12.2% | 12.3% | 21.8% | 10.3% | 6.0% |
Region matters
There are important regional variations in the housing repair gaps between the non-Indigenous population and Registered Indians living off reserve and Non-Status Indians, particularly in the Northwest Territories. When considering First Nations populations, however, it is the gap for Registered Indians living on reserve that has the most striking regional variations, going from a low of 21.0 percentage points wide in Nova Scotia to a high of 42.0 percentage points wide in Manitoba (Figure 48).

Text alternative for Figure 48: Percentage of dwellings in need of major repair, 2016, First Nations and non-Indigenous populations, by region
| Registered Indian on reserve | Registered Indian off reserve | Non-Status Indian | Non-Indigenous | |
|---|---|---|---|---|
| Newfoundland and Labrador | 28.3% | 9.0% | 9.2% | 6.1% |
| Prince Edward Island | 30.8% | 14.6% | 13.9% | 7.5% |
| Nova Scotia | 29.4% | 11.6% | 16.0% | 8.4% |
| New Brunswick | 32.7% | 11.7% | 15.6% | 7.9% |
| Quebec | 31.9% | 10.3% | 11.2% | 6.2% |
| Ontario | 37.4% | 11.2% | 13.6% | 5.8% |
| Manitoba | 48.8% | 15.6% | 15.3% | 6.9% |
| Saskatchewan | 48.0% | 12.3% | 11.8% | 6.9% |
| Alberta | 46.7% | 10.3% | 8.6% | 5.1% |
| British Columbia | 33.2% | 12.5% | 11.3% | 5.8% |
| Yukon | N/A | 23.0% | 10.8% | 9.4% |
| Northwest Territories | 47.1% | 28.8% | 23.7% | 9.9% |
| Nunavut | N/A | 14.3% | 0.0% | 11.6% |
As Figure 49 illustrates, the housing repair gap between Métis and the non-Indigenous population was relatively consistent across regions, with Métis dwellings in all regions being at least somewhat more likely to be in need of major repair.

Text alternative for Figure 49: Percentage of dwellings in need of major repair, 2016, Métis and non-Indigenous populations, by region
| Métis | Non-Indigenous | |
|---|---|---|
| Newfoundland and Labrador | 9.5% | 6.1% |
| Prince Edward Island | 8.8% | 7.5% |
| Nova Scotia | 11.3% | 8.4% |
| New Brunswick | 12.2% | 7.9% |
| Quebec | 11.0% | 6.2% |
| Ontario | 10.9% | 5.8% |
| Manitoba | 10.8% | 6.9% |
| Saskatchewan | 10.0% | 6.9% |
| Alberta | 9.2% | 5.1% |
| British Columbia | 9.1% | 5.8% |
| Yukon | 17.2% | 9.4% |
| Northwest Territories | 16.2% | 9.9% |
| Nunavut | 20.0% | 11.6% |
Figure 50 shows that, outside Inuit Nunangat, the percentage of Inuit dwellings that are in need of major repair exceeds that of non-Indigenous dwellings by 4.8 percentage points. While not apparently large, this gap does mean that Inuit dwellings are nearly twice as likely to be in need of major repairs as non-Indigenous dwellings. Inside Inuit Nunangat, the repair gap for Inuit dwellings is relatively consistent across regions, ranging from 13.4 (in Nunavik) percentage points to 19.1 (in Nunavut).

Text alternative for Figure 50: Percentage of dwellings in need of major repair, 2016, Inuit and non-Indigenous populations, by region
| Nunatsiavut (Labrador) | Nunavik (Northern Quebec) | Inuvialuit Region (NWT and Yukon) | Nunavut | Outside of Inuit Nunangat | |
|---|---|---|---|---|---|
| Inuit | 30.6% | 22.4% | 29.5% | 30.7% | 10.9% |
| Non-Indigenous | 15.4% | 9.1% | 12.9% | 11.6% | 6.0% |
Family – children in foster care
Indigenous children are far more likely than non-Indigenous children to be in foster care. Even though Indigenous peoples make up only 4.9% of the population of Canada, Indigenous children make up almost half of the children in foster care (Figure 51)Footnote 35.
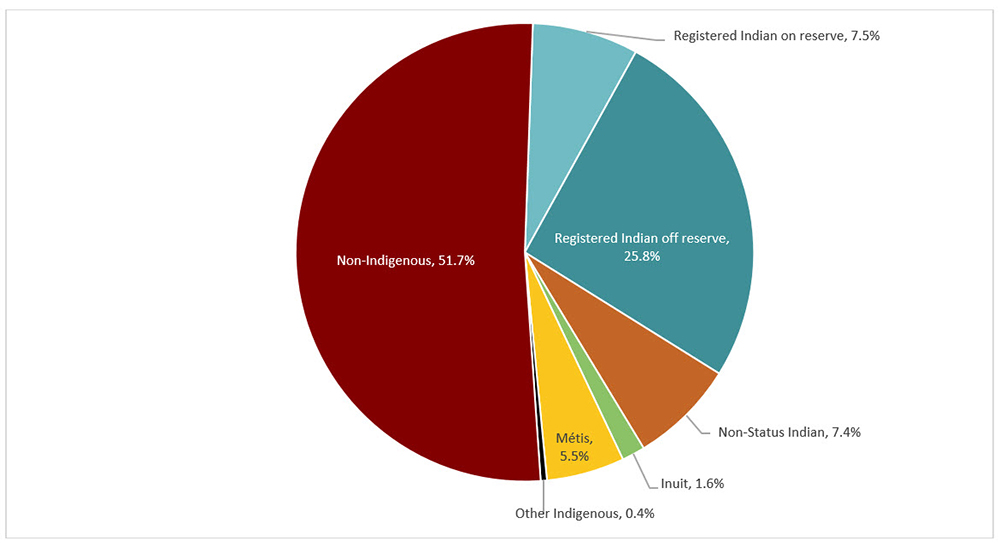
Text alternative for Figure 51: Percentage of Indigenous and non-Indigenous children comprising the total population of children aged 0-17 in foster care, 2016, Canada
| Registered Indian on reserve | Registered Indian off reserve | Non-Status Indian | Inuit | Métis | Other Indigenous | Non-Indigenous | |
|---|---|---|---|---|---|---|---|
| Percentage of children comprising the total population of children aged 0-17 in foster care | 7.5% | 25.8% | 7.4% | 1.6% | 5.5% | 0.4% | 51.7% |
As Figure 52 illustrates, even though relatively few Indigenous and non-Indigenous children are in foster care, the likelihood of being in foster care is much higher for Indigenous children. Registered Indian children, in particular, are 15 times more likely than non-Indigenous children to be in foster care.
Note that Figure 52 includes a statistic for all Registered Indian children, in addition to the breakdown between those living on and off reserve. In subsequent charts related to foster care, the breakdown is not included as it may be misleading, since Registered Indian children living in foster care off reserve may come from families living on reserve.

Text alternative for Figure 52: Percentage of children aged 0-17 in foster care, 2016, Indigenous and non-Indigenous populations, Canada
| Registered Indian (total) | Registered Indian on reserve | Registered Indian off reserve | Non-Status Indian | Inuit | Métis | Non-Indigenous | |
|---|---|---|---|---|---|---|---|
| Percentage of children comprising the total population of children aged 0-17 in foster care | 4.5% | 2.2% | 6.4% | 3.1% | 2.4% | 1.3% | 0.3% |
Data on foster care gaps is only available for two time periods, as this information was only first captured in the 2011 National Household Survey, which was that year's equivalent to the long-form census. As Figure 53 shows, the percentage of children in foster care fell between 2011 and 2016 for all Indigenous groups except for Non-Status Indians, who saw a slight increase in the percentage of children in foster care. Since the proportion of non-Indigenous children in foster care (0.3%) did not change between 2011 and 2016, all Indigenous groups except for Non-Status Indians experienced a small decrease in the foster care gap.

Text alternative for Figure 53: Percentage of children aged 0-17 in foster care, 2011 – 2016, Indigenous and non-Indigenous populations, Canada
| Registered Indians (total) | Non-Status Indian | Inuit | Métis | Non-Indigenous | |
|---|---|---|---|---|---|
| 2011 | 5.0% | 2.8% | 2.7% | 1.4% | 0.3% |
| 2016 | 4.5% | 3.1% | 2.4% | 1.3% | 0.3% |
Region matters
Figure 54 illustrates that, although there are some regions in which the foster care gap for Non-Status Indians is small or negligible, the gap for Registered Indians is always pronounced. In Manitoba the gaps for both Registered Indians (6.8 percentage points) and Non-Status Indians (12.4 percentage points) are particularly large.

Text alternative for Figure 54: Percentage of children aged 0-17 in foster care, 2016, First Nations and non-Indigenous populations, by region
| Registered Indians | Non-Status Indian | Non-Indigenous | |
|---|---|---|---|
| Newfoundland and Labrador | 2.5% | 0.7% | 0.5% |
| Prince Edward Island | 0.0% | 0.0% | 0.4% |
| Nova Scotia | 2.9% | 0.3% | 0.4% |
| New Brunswick | 2.1% | 0.9% | 0.4% |
| Quebec | 3.0% | 1.6% | 0.4% |
| Ontario | 3.0% | 1.6% | 0.2% |
| Manitoba | 7.2% | 12.8% | 0.4% |
| Saskatchewan | 2.9% | 5.0% | 0.2% |
| Alberta | 5.4% | 4.2% | 0.2% |
| British Columbia | 5.3% | 3.6% | 0.3% |
| Yukon | 3.8% | 5.4% | 0.0% |
| Northwest Territories | 2.5% | 0.0% | 0.2% |
| Nunavut | 0.0% | 0.0% | 0.0% |
Figure 55 shows a comparison of the percentage of Métis and non-Indigenous children in foster care. Although the percentages seem very high in Nunavut and the Yukon, they are based on extremely small numbers of Métis children in those regions (25 and 245 children, respectively). It is likely more valuable to focus on Manitoba and British Columbia, which have large Métis populations and comparatively high percentages of Métis children in foster care.

Text alternative for Figure 55: Percentage of children aged 0-17 in foster care, 2016, Métis and non-Indigenous populations, by region
| Métis | Non-Indigenous | |
|---|---|---|
| Newfoundland and Labrador | 0.0% | 0.5% |
| Prince Edward Island | 0.0% | 0.4% |
| Nova Scotia | 0.2% | 0.4% |
| New Brunswick | 0.0% | 0.4% |
| Quebec | 0.6% | 0.4% |
| Ontario | 0.5% | 0.2% |
| Manitoba | 2.7% | 0.4% |
| Saskatchewan | 1.2% | 0.2% |
| Alberta | 1.2% | 0.2% |
| British Columbia | 2.1% | 0.3% |
| Yukon | 6.1% | 0.0% |
| Northwest Territories | 0.0% | 0.2% |
| Nunavut | 40.0% | 0.0% |
Although small numbers make it difficult to interpret differences in the percentage of Inuit who are in foster care across Inuit regions, it is notable that the percentage of Inuit children in care inside Inuit Nunangat (1.4%) is lower than the percentage outside Inuit Nunangat (5.7%). Again, this pattern might be misleading as some Inuit children in foster care outside Inuit Nunangat might originate from families inside Inuit Nunangat.
Culture – Indigenous language knowledge
Indigenous languages have a very important role in Indigenous cultures, and reflect the rich and distinct worldviews of the different Indigenous nations across the country.
Knowledge of Indigenous languages is not compared to non-Indigenous languages in this report. Instead, the report examines trends in Indigenous language use over time and whether those trends reflect Indigenous peoples' aspirations with respect to the preservation and practice of their ancestral languages.
According to the 2012 Aboriginal Peoples SurveyFootnote 36, half of Indigenous peoples living off reserve reported that it was somewhat or very important to them to speak an Indigenous language (66.9% of Registered Indians, 45.3% of Non-Status Indians, 80.9% of Inuit, and 36.8% of Métis).Footnote 37 Similarly, according to the First Nations Regional Early Childhood, Education, and Employment survey, the vast majority of First Nations adults living on reserve or in a northern First Nation community reported that it was somewhat or very important to them to understand (91.4%) and speak (90.8%) a First Nations language.Footnote 38
As Figure 56 demonstrates, knowledge of an Indigenous language, defined in terms of one's self-reported ability to conduct a conversation in the language, is common only among Inuit (64.8%) and Registered Indians living on reserve (44.8%).

Text alternative for Figure 56: Percentage of Indigenous populations with knowledge of an Indigenous language, 2016, Canada
| Registered Indian on reserve | Registered Indian off reserve | Non-Status Indian | Inuit | Métis | |
|---|---|---|---|---|---|
| Percentage of Indigenous populations with knowledge of an Indigenous language | 44.8% | 11.7% | 1.9% | 64.8% | 1.6% |
Figure 57 illustrates that knowledge of an Indigenous language has declined slowly over time, when one considers the proportion of Indigenous people who can conduct a conversation in an Indigenous language.

Text alternative for Figure 57: Percentage of Indigenous populations with knowledge of an Indigenous language, 2001 – 2016, Canada
| Registered Indian on reserve | Registered Indian off reserve | Non-Status Indian | Inuit | Métis | |
|---|---|---|---|---|---|
| 2001 | 49.5% | 17.8% | 5.3% | 72.0% | 5.0% |
| 2006 | 50.8% | 16.3% | 3.2% | 70.9% | 3.3% |
| 2011 | 44.6% | 12.3% | 2.2% | 64.0% | 2.4% |
| 2016 | 44.8% | 11.7% | 1.9% | 64.8% | 1.6% |
Region matters
Figure 58 demonstrates that, among First Nations, the ability to conduct a conversation in an Indigenous language varies considerably across regions, with rates among Registered Indians living on reserve ranging from as low as 10.7% in Prince Edward Island to as high as 80.0% in Quebec; and rates among Registered Indians living off reserve ranging from as low as 2.8% in Newfoundland and Labrador to as high as 40.2% in the Northwest Territories. Even Non-Status Indians, whose national rate of Indigenous language knowledge is less than two percent, have a rate approaching 10% in Saskatchewan. Their rate is even higher in the Northwest Territories and Nunavut, though it is worth emphasizing that the populations of Non-Status Indians in these regions is quite small.

Text alternative for Figure 58: Percentage of First Nations with knowledge of an Indigenous language, 2016, by region
| Registered Indian on reserve | Registered Indian off reserve | Non-Status Indian | |
|---|---|---|---|
| Newfoundland and Labrador | 64.6% | 2.8% | 0.3% |
| Prince Edward Island | 10.7% | 3.0% | 0.0% |
| Nova Scotia | 54.2% | 4.8% | 0.6% |
| New Brunswick | 31.8% | 7.2% | 1.2% |
| Quebec | 80.0% | 12.2% | 2.0% |
| Ontario | 41.1% | 7.9% | 1.1% |
| Manitoba | 46.2% | 15.5% | 4.6% |
| Saskatchewan | 42.5% | 18.4% | 9.8% |
| Alberta | 45.1% | 13.6% | 3.3% |
| British Columbia | 20.1% | 6.4% | 1.1% |
| Yukon | N/A | 17.4% | 5.7% |
| Northwest Territories | 26.3% | 40.2% | 16.1% |
| Nunavut | N/A | 35.3% | 18.8% |
The ability to conduct a conversation in an Indigenous language varies markedly for Métis, with the highest rates seen in the large Métis populations in Saskatchewan and Alberta (Figure 59). Higher rates are also evident in the Northwest Territories and Nunavut, but again, it is important to note that Métis populations in these regions are small – particularly in Nunavut where only approximately 140 Métis reside.

Text alternative for Figure 59: Percentage of Métis with knowledge of an Indigenous language, 2016, by region
| Métis | |
|---|---|
| Newfoundland and Labrador | 0.4% |
| Prince Edward Island | 0.0% |
| Nova Scotia | 0.1% |
| New Brunswick | 0.2% |
| Quebec | 0.3% |
| Ontario | 0.4% |
| Manitoba | 0.9% |
| Saskatchewan | 6.7% |
| Alberta | 2.5% |
| British Columbia | 0.5% |
| Yukon | 1.7% |
| Northwest Territories | 5.7% |
| Nunavut | 24.1% |
As Figure 60 illustrates, knowledge of an Indigenous language varies widely across the four Inuit regions. The vast majority of Inuit in Nunavik (99.3%) and Nunavut (89.1%) can conduct a conversation in an Indigenous language, compared to less than a quarter in each of Nunatsiavut (21.4%) and Inuvialuit Region (23.3%). Among Inuit living outside Inuit Nunangat, knowledge of an Indigenous language is comparatively rare at 11.6%.

Text alternative for Figure 60: Percentage of Inuit with knowledge of an Indigenous language, 2016, by region
| Nunatsiavut (Labrador) | Nunavik (Northern Quebec) | Inuvialuit Region (NWT and Yukon) | Nunavut | Outside of Inuit Nunangat | |
|---|---|---|---|---|---|
| Percentage of Inuit with knowledge of an Indigenous language | 21.4% | 99.3% | 23.3% |
89.1% | 11.6% |
A focus on gender
As Figure 61 demonstrates, the likelihood of knowing an Indigenous language is similar for males and females across Indigenous groups.

Text alternative for Figure 61: Percentage of Indigenous populations with knowledge of an Indigenous language, 2016, by gender, Canada
| Registered Indian on reserve | Registered Indian off reserve | Non-Status Indian | Inuit | Métis | Non-Indigenous | |
|---|---|---|---|---|---|---|
| Percentage of Indigenous populations with knowledge of an Indigenous language | 47.7% | 30.3% | 25.2% | 22.3% | 17.3% | 13.8% |
The percentage of Indigenous peoples with knowledge of an Indigenous language is only one way of assessing the long-term viability of Indigenous language use. The sheer number of language users is also important.Footnote 39 For example, a language whose 100,000 speakers represent only 10% of a population may be equally or more viable as a language whose 100 speakers comprise 100% of its population. With this is mind, it is important to note that, owing to the growth of Indigenous populations, the raw number of individuals who can conduct a conversation in an Indigenous language actually increased between 2001 and 2016 for some Indigenous groups: by 18,820 for Registered Indians living on reserve; by 4,635 for Registered Indians living off reserve; and, by 9,910 for Inuit (Figure 62). The raw number of Individuals able to conduct a conversation in an Indigenous language decreased by 4,555 among Métis and by 1,195 among Non-Status Indians, highlighting the particular vulnerability of Indigenous language knowledge in these populations.

Text alternative for Figure 62: Change in number of people with knowledge of an Indigenous language, 2001 – 2016, Canada
| Registered Indian on reserve | Registered Indian off reserve | Non-Status Indian | Inuit | Métis | |
|---|---|---|---|---|---|
| Change in number of people with knowledge of an Indigenous language | 18,820 | 4,635 | -1,195 | 9,910 | -4,555 |
Looking at younger individuals is another way of examining the health and longevity of a language, since the survival of a language is heavily dependent on its transmission from parent or guardian to child in the home.Footnote 40 As Figure 63 illustrates, among Registered Indians on reserve those aged 0-19 (33.3%) are markedly less likely than their older counterparts (52.7%) to be able to conduct a conversation in an Indigenous language. A similar pattern is apparent among Registered Indians off reserve, with 7.8% of those aged 0-19 being able to conduct a conversation in an Indigenous language, as compared to 13.7% of older individuals. Among Métis aged 0-19, the ability to conduct a conversation in an Indigenous language has dropped below one percent. By contrast, younger people are actually slightly more likely than older Inuit to be able to conduct a conversation in an Indigenous language, suggesting strong long-term resilience of Indigenous language knowledge among Inuit. Although the percentage of Non-Status Indians who can conduct a conversation in an Indigenous language is slightly higher among younger (2.0%) than older (1.8%) individuals, the overall percentage is so small that the precariousness of knowledge of an Indigenous language in this population must still be highlighted.

Text alternative for Figure 63: Percentage of Indigenous populations with knowledge of an Indigenous language, 2016, aged 0-19 and aged 20+, Canada
| Registered Indian on reserve | Registered Indian off reserve | Non-Status Indian | Inuit | Métis | |
|---|---|---|---|---|---|
| Aged 0-19 | 33.3% | 7.8% | 2.0% | 65.7% | 0.9% |
| Aged 20+ | 52.7% | 13.7% | 1.8% | 64.2% | 1.9% |
Health – life expectancy
Life expectancy is one of the key, internationally-recognized indicators of population health. Reliable life expectancy estimates for First Nations, Inuit, and Métis populations are currently readily available for only two time periods: 2006 and 2011, and only at the national level. These estimates were developed using population-based linked datasets called the Canadian Census Health and Environment Cohorts (CanCHECs), and were published by Statistics Canada in a 2019 article entitled Life expectancy of First Nations, Métis and Inuit household populations in Canada.Footnote 41
Figure 64 below illustrates the average life expectancies at age oneFootnote 42 for First Nations, Inuit, Métis and Non-Indigenous populations in 2011.
The life expectancy gaps relative to the non-Indigenous population in 2011 were 8.9 years and 9.6 years for First Nations males and females, respectively; 11.4 and 11.2 years for Inuit males and females, respectively; and 4.5 and 5 years for Métis males and females, respectively.

Text alternative for Figure 64: Life expectancy at age one, 2011, Indigenous and Non-Indigenous Populations, by gender, Canada
| First Nations | Métis | Inuit | Non-Indigenous | |
|---|---|---|---|---|
| Male | 72.5 | 76.9 | 70 | 81.4 |
| Female | 77.7 | 82.3 | 76.1 | 87.3 |
Figure 65 illustrates that life expectancy for males and females in Indigenous and non-Indigenous populations increased slightly between 2006 and 2011. Among males, Inuit life expectancy increased the most, and their gap relative to the non-Indigenous population narrowed slightly. The gap for First Nations and Métis, however, widened slightly. Among females, the life expectancy of the non-Indigenous population increased the most, meaning the life expectancy gaps for First Nations, Inuit, and Métis females increased slightly.

Text alternative for Figure 65: Life expectancy at age one, 2006 – 2011, by gender (male), Canada
| Male | First Nations | Métis | Inuit | Non-Indigenous |
|---|---|---|---|---|
| 2006 | 71.6 | 76 | 68 | 80.1 |
| 2011 | 72.6 | 76.9 | 70 | 81.4 |

Text alternative for Figure 65: Life expectancy at age one, 2006 – 2011, by gender (female), Canada
| Female | First Nations | Métis | Inuit | Non-Indigenous |
|---|---|---|---|---|
| 2006 | 77.1 | 81.5 | 75.2 | 85.8 |
| 2011 | 77.7 | 82.3 | 76.1 | 87.3 |
Health – infant mortality
Another key international indicator of population health is infant mortality, which is monitored by organizations such as the Organization for Economic Cooperation and Development and the World Health Organization.
The indicator is defined in terms of the number of infants who die before age one, expressed as a rate per thousand live births. Reliable life expectancy estimates that are comparable for First Nations, Inuit, Métis, and non-Indigenous populations are currently readily available for only a single point in time, based on a cohort of singleton births (May 16, 2004 through May 15, 2006) created by linking the Canadian Live Birth, Infant Death, and Stillbirth Database of the 2006 Census. Results were published by Statistics Canada in a 2017 article entitled Birth outcomes among First Nations, Inuit and Métis populations.Footnote 43
Figure 66 illustrates that infant mortality is higher for each of the three Indigenous groups than for the non-Indigenous population. The error bars highlight that there is some imprecision in the estimates for the Indigenous groups. Nevertheless, First Nations, Inuit, and Métis infant mortality rates are measured to be 2.1, 2.8, and 2.4 times the rate of the non-Indigenous population, respectively.

Text alternative for Figure 66: Infant mortality rate per 1,000 live births, May 2004-May 2006 cohort, Canada
| First Nations | Inuit | Métis | Non-Indigenous | |||||||||
|---|---|---|---|---|---|---|---|---|---|---|---|---|
| Rate | 95% confidence interval (from/to) | Rate | 95% confidence interval (from/to) | Rate | 95% confidence interval (from/to) | Rate | 95% confidence interval (from/to) | |||||
| Infant mortality rate per 1,000 live births | 9.2 | 7.5 | 11.3 | 12.3 | 9.9 | 15.2 | 10.5 | 7.1 | 15.5 | 4.4 | 4.2 | 4.7 |
Justice – victimization
Being safe in one's community is a key factor in well-being, and can be measured in various ways. This report looks specifically at experiences of violent victimization, which are measured in the 2018 Survey of Safety in Public and Private Spaces in terms of whether one has experienced physical or sexual assault since the age of 15.
Figure 67 illustrates that Indigenous peoples are significantly more likely than the non-Indigenous population to have experienced violent victimization, with the gap being 17.1 percentage points wide among women and 20.2 percentage points wide among men. Not enough Inuit were surveyed to allow analyses specific to Inuit, and no data are currently available that distinguish Registered Indians from Non-Status Indians, or those living on versus off reserve. Published statistics on First Nations and Métis suggest that their rates of violent victimization are similarly elevated. Error bars are included in the chart to highlight that the Indigenous sample in the source survey was small, and the apparent differences between First Nations and Métis were not precisely measured and could be due to chance.

Text alternative for Figure 67: Percentage who experienced violent victimization since the age of 15 years, 2018, aged 15+, Canada
| Indigenous (total) | Non-Indigenous | First Nations | Métis | |||||||||
|---|---|---|---|---|---|---|---|---|---|---|---|---|
| Male | Percentage | 95% confidence interval (from/to) | Percentage | 95% confidence interval (from/to) | Percentage | 95% confidence interval (from/to) | Percentage | 95% confidence interval (from/to) | ||||
| Infant mortality rate per 1,000 live births | 54.9% | 49.1% | 60.5% | 34.7% | 33.6% | 35.8% | 49.8% | 40.6% | 59.0% | 58.9% | 51.4% | 66.1% |
| Indigenous (total) | Non-Indigenous | First Nations | Métis | |||||||||
|---|---|---|---|---|---|---|---|---|---|---|---|---|
| Female | Percentage | 95% confidence interval (from/to) | Percentage | 95% confidence interval (from/to) | Percentage | 95% confidence interval (from/to) | Percentage | 95% confidence interval (from/to) | ||||
| Infant mortality rate per 1,000 live births | 55.3% | 50.2% | 60.2% | 38.2% | 37.1% | 39.2% | 58.0% | 50.5% | 65.1% | 55.0% | 48.2% | 61.5% |
Justice – incarceration
Disproportionate levels of incarceration can be a strong signal that a holistic examination is in order of both crime and institutional responses to it.
Figures 68 and 69 below show data from the Adult Correctional Services Survey.Footnote 45 Figure 68 provides a rough estimate of the differences in incarceration rates between Indigenous and the non-Indigenous population in 2016/17. Specifically, it presents the number of custody admissionsFootnote 46 associated with Indigenous and the non-Indigenous population in 2016/17 as a percentage of their respective 2016 census populations.Footnote 47 Since a single person can have more than one custody admission in a year, this percentage does not represent a true rate. Nevertheless, it does suggest that custody admissions are far more common among Indigenous peoples than the non-Indigenous population.

Text alternative for Figure 68: Custody admissions associated with Indigenous and the non-Indigenous population in 2016/17 as a percentage of their respective 2016 Census populations, Canada
| Indigenous | Non-Indigenous | |
|---|---|---|
| Custody admissions associated with Indigenous and non-Indigenous people in 2016/17 as a percentage of their respective 2016 Census populations | 4.5% | 0.5% |
Figure 69 demonstrates the degree to which Indigenous people were overrepresented among custody admissions to correctional services in the years 2013/14 through 2017/18. According to the 2016 Census, Indigenous people made up 4.9% of the population of Canada that year. In 2016/17, however, the Adult Correctional Services Survey determined that Indigenous peoples were involved in 29.9% of custody admissions.

Text alternative for Figure 69: Percentage of custody admissions of individuals with Indigenous and Non-Indigenous identity, 2013/2014 – 2017/2018, Canada
| Indigenous | Non-Indigenous | |
|---|---|---|
| 2013/2014 | 25.8% | 74.2% |
| 2014/2015 | 26.2% | 73.8% |
| 2015/2016 | 26.7% | 73.3% |
| 2016/2017 | 29.9% | 70.1% |
| 2017/2018 | 30.1% | 69.9% |
A focus on urban settings
According to the 2016 Census, about 45% of Registered Indians, 76% of Non-Status Indians, 50% of Inuit, and 70% of Métis live in urban areas. In some cases, census data for the indicators considered in this report were readily available disaggregated for urban populations.Footnote 48
Analyses of these data revealed that gaps between Indigenous and non-Indigenous populations living in urban settings are generally similar to those that exist between Indigenous and non-Indigenous populations overall. Employment rates provide a useful illustration. Figure 70 shows the employment rate gaps between Indigenous and non-Indigenous populations overall, and Figure 71 shows the gaps for urban sub-populations. Urban and overall rates are within a percentage point of each other for Registered Indians living off reserve, Non-Status Indians, and the non-Indigenous population. The difference is somewhat more marked among Inuit, whose employment rate is about two and a half percentage points higher in an urban environment. The tendency to see higher outcomes for Inuit in urban areas (and smaller gaps relative to the non-Indigenous population), echoes earlier regional analyses, which showed the large differences in socioeconomic outcomes between Inuit living in Inuit Nunangat, and those residing in the South.

Text alternative for Figure 70: Employment rate, 2016, Indigenous and non-Indigenous populations, aged 25-64, Canada
| Registered Indian on reserve | Registered Indian off reserve | Non-Status Indian | Inuit | Métis | Non-Indigenous | |
|---|---|---|---|---|---|---|
| Employment rate | 46.9% | 60.2% | 66.1% | 57.4% | 70.4% | 76.0% |

Text alternative for Figure 71: Employment rate, 2016, Indigenous and non-Indigenous populations, aged 25-64, urban areas, Canada
| Registered Indian off reserve | Non-Status Indian | Inuit | Métis | Non-Indigenous | |
|---|---|---|---|---|---|
| Employment rate | 60.0% | 67.1% | 60.0% | 71.4% | 76.4% |
Conclusion – addressing data gaps
Indigenous Services Canada continues to take steps to improve the quality and availability of data on Indigenous populations to ensure that socioeconomic gaps between Indigenous and the non-Indigenous populations can be measured reliably and comprehensively.
First, the department continues to provide funding and expertise to support the Census of Canada, which continues to be the cornerstone of data on Indigenous populations in Canada. It not only provides high quality data that are comparable across populations and over time, and which are generally available even down to the community level, but it functions as a technical foundation for data integration, sampling, and data processing.
Second, the department continues to invest in specialized surveys on Indigenous populations. These include:
- the Surveys on Indigenous Peoples, which received permanent funding ($49.4 million over five years and $9.9 million per year ongoing) through Budget 2019 and which covers First Nations living on and off reserve, as well as Inuit and Métis;
- the First Nations Regional Health Survey, which received permanent funding in Budget 2019 ($24.7 million over four years and $4.9 million ongoing); and
- the new Inuit Health Survey, which received permanent funding in Budget 2018 ($82 million over 10 years and $6 million per year ongoing).
Importantly, the bulk of these funds were allocated to Indigenous organizations. Given the increasing recognition that strong, Indigenous-led data capacity is key to Indigenous peoples' self-determination and Indigenous Services Canada's ultimate goal of service transfer, the department prioritized survey initiatives that supported Indigenous peoples themselves to identify and address the data gaps impacting their populations.
Third, the department has invested in a number of surveys of the general Canadian population. These investments ($770,000 in the 2019 General Social Survey on Victimization; $660,000 in the upcoming National Legal Problems Survey; and $1,300,000 for the upcoming Programme for the International Assessment of Adult Competencies survey of literacy, numeracy, and problem-solving skills) will allow Statistics Canada to collect data from enough Indigenous peoples that Indigenous-specific data will be possible and gaps relative to the non-Indigenous population can be identified.
Fourth, Indigenous Services Canada is turning its attention increasingly towards administrative data, or more specifically, the integration of select administrative data sources with other data sources (such as Census and survey data), to produce powerful new data sets at relatively low cost and without increasing respondent burden. Indigenous Services Canada has developed a partnership with Statistics Canada, through which administrative data from departmental programs are shared with Statistics CanadaFootnote 49, who explores their potential to be integrated with other data sets and used for new statistical purposes. The first major new dataset to be developed is called the Longitudinal Indian Register Database, which Statistics Canada produced by linking the Indian Register that Indigenous Services Canada manages with tax data from the Canada Revenue Agency. Indigenous Services Canada has also shared its administrative data on infrastructure with Statistics Canada, who is using it to validate and supplement on reserve data from Canada's Core Public Infrastructure Survey; as well as the department's data holdings related to First Nation Chiefs and councilors, which Statistics Canada will use to report on gender representation among First Nation Chiefs and councillors.Footnote 50
Notably, Indigenous Services Canada's data sharing and integration relationship with Statistics Canada is just one element of the broader efforts being undertaken to improve and integrate the department's administrative data holdings. Although Indigenous Services Canada must rely on Statistics Canada to integrate data about individual people, the department is taking steps to harmonize and integrate community-level data holdings, as a means of reducing respondent burden, improving data quality, facilitating fast and accurate reporting, and creating a multidimensional data set that will help program and policy makers understand the interrelationships between program and policy areas, so that services to Indigenous communities can be improved.
Fifth, as part of the New Fiscal Relationship the department is working with the Assembly of First Nations and the First Nations Information Governance Centre to co-develop and engage with First Nations on a National Outcomes-Based Framework to better measure and report on the closure of socio-economic gaps between First Nations and non-Indigenous Canadians. This work also responds to numerous reports and studies, over the past 40 years which have consistently underlined the negative impacts of a narrow focus on compliance and its associated recipient reporting burden, calling for a shift to a focus on outcomes. Most recently in the spring of 2018, the Office of the Auditor General (OAG) released Report 5 "Socio-economic Gaps on First Nations Reserves – Indigenous Services Canada". The report found that the department did not have a comprehensive picture of well-being of on reserve First Nations people compared with other Canadians as measured by the Community Well-being Index, and indicated that while the Index includes important measures of well-being (i.e., education, employment, housing, income), it does not include critical variables such as health, environment, language and culture. The department agreed with the OAG recommendation, highlighting in its response that it would build on the Community Well-being Index by co-developing, with First Nations and other partners, a broad dashboard of well-being outcomes that will reflect mutually agreed-upon metrics in measuring and reporting on closing socio-economic gaps. This means that the right data are necessary to track progress on priorities as identified by First Nations, and to demonstrate outcomes for Canadians on the closure of the socio-economic gaps between First Nations and non-Indigenous Canadians.
Finally, although improving Indigenous Services Canada's service delivery to Indigenous peoples is an important immediate goal, the department's data development work is also oriented to the longer-term goal of service transfer. The investments in survey and administrative data described above will help ensure that Indigenous peoples have a wealth of high-quality data to support them as they take on increasing responsibilities for their members. At the same time, the department is exploring ways to support Indigenous peoples to develop their capacity to govern, manage, and use those data. For example, Budget 2018 included $2.5 million for the First Nations Information Governance Centre to support their design of a national First Nations data governance strategy and coordination of efforts to establish regional First Nations data governance centres. In support of the Government's commitment to address the over-representation of Indigenous children and youth in care, Indigenous Services Canada continues to work with Indigenous, provincial and territorial partners to co-develop inter-jurisdictional data collection, sharing and reporting on Indigenous children in care. As Indigenous Services Canada continues to craft its own data strategyFootnote 51, the department will seek opportunities to support Inuit and Métis as well in their development and implementation of evidence-based approaches to this transfer of responsibilities and communities' ongoing provision of services.
Part 2:
Addressing socioeconomic gaps through improved access to services
Introduction
The provision of essential services to citizens is a core business of government. The term "essential or core services" often refers to services that are critical to the public's health and safety and can include services such as healthcare, social services, infrastructure, and emergency response. By definition, essential services must be available and accessible to all Canadians. Historically, there have been gaps in the availability and accessibility of some services for Indigenous peoples creating significant disadvantages. Ensuring that Indigenous peoples have access to services comparable to other Canadians is a core priority for Indigenous Services Canada and key to reducing socioeconomic gaps. However, this alone is not enough to redress decades of underfunding. Efforts must aim toward achieving substantive equality, which refers to the achievement of true equality in outcomes. It is achieved through equal access and opportunity and, most importantly, the provision of services and benefits in a manner and according to standards that meet unique needs and circumstances, such as cultural, social, economic and historical disadvantage, of the people that access them. Addressing gaps in access to essential services is the first step toward closing socioeconomic gaps between Indigenous and the non-Indigenous population.
There are currently 34 federal departments and agencies with responsibility to meet the Canada's obligations and commitments to Indigenous peoples. The Minister of Indigenous Services Canada leads federal efforts to achieve substantive equality for Indigenous peoples, a cornerstone of the broader approach towards reconciliation. Indigenous Services Canada is responsible for supporting the provision of core services to Indigenous peoples including child and family services, education, health, social development, economic development, housing, infrastructure, access to potable water, and emergency response. It does this through a variety of authorities and arrangements which have evolved over time to address specific conditions and requirements. These services are vital to the overall wellbeing of Indigenous communities, and are a necessary precursor to Indigenous peoples fully participating in Canada's society and economy. It is, therefore, incumbent upon the federal government to ensure that Indigenous peoples in Canada have access to essential services that aim to achieve substantive equality in order to ensure comparable access to services as non-Indigenous Canadians.
Complex delivery environment
The context in which services are provided to Indigenous peoples is a complex one due to a number of factors. The Indigenous population is rapidly increasing as a result of both natural growth and policy changes which in turn heightens overall demand for core services. Between the 2006 and 2016 Censuses, the Indigenous population increased at a rate four times faster than the non-Indigenous population. Compounding this natural population increase is the passage of An Act to amend the Indian Act in response to the Superior Court of Quebec decision in Descheneaux c. Canada, which received Royal Assent in 2017. This legislation removed all known sex-based inequities in the Indian Act.Footnote 52 The Parliamentary Budget Officer has estimated that the changes will result in between 270,000 and 450,000 additional individuals being eligible to register as status Indians, which will have a proportional impact on Indigenous Services Canada's demand-driven programs.
Another factor that adds to the complexity is the evolving service context; specifically the interactions between federal and provincial systems, as well as the introduction of Indigenous-led organizations. To date, the federal government has played a lead role in the delivery of services to First Nations living on reserve that would otherwise be delivered by provinces or territories. In contrast, provinces and territories deliver services in many of the same areas for First Nations living off reserve, Inuit, and Métis. Consequently, the provision of targeted and culturally appropriate services for First Nations, Inuit, and Métis are somewhat limited and vary considerably across jurisdictions. In some areas of provincial jurisdiction, Indigenous Services Canada has adopted alternative service delivery models involving bilateral or tripartite agreements, that specify their own distinct coordination of funding and service delivery.
Indigenous governance structures also add complexity to this evolving dynamic as they vary across the country and jurisdictions, as well as across services and programs. Western-style forms of governance do not always align with traditional Indigenous governance systems, and vice versa, making it sometimes challenging for these systems to work well together. This issue highlights the importance of incorporating Indigenous ways of being, knowing and understanding in the design, development, and delivery of services to Indigenous peoples, which is most easily accomplished if this work is Indigenous-led.
Complex delivery mechanisms
Currently, federal Indigenous programs and services are based on the application of various criteria, which can be a combination of: 1) distinction-based (i.e., First Nation, Inuit, Métis); 2) place (i.e., northern or southern); and/or, 3) residency (i.e., living on or off reserve; living in a claim settlement area; etc.). Registration under the Indian Act, residency on a recognized land base, and membership in a recognized Indigenous community are the three main criteria used to delimit those individuals entitled to certain program, treaty or statutory benefits. At times, the varying criteria for determining eligibility for programs and services can create a patchwork of conditions that do not necessarily address the disparate circumstances, interests or needs of all Indigenous peoples or individuals.
Small community populations and the relative remoteness of many Indigenous communities can also impact the quality of and access to services. A small population base can, for example, make it difficult to find and employ technicians to manage water filtration systems, teachers, nurses, or a police force. Access to these types of professionals is often taken for granted within larger population centres. A common co-relating factor to population size is the remoteness of many Indigenous communities, which can create pressure on two fronts as costs are proportionally higher for communities with fewer resources. While technology is beginning to address some of the barriers associated with delivering services to remote and small communities, such as eHealth and access to physicians via videoconference, more remains to be done to fully address the needs of individuals in these communities (i.e., transforming health services and access to broadband).
Finally, emergency events are increasing in both frequency and intensity (e.g., fire, flooding, communicable diseases, etc.). First Nations are 18 times more likely to be evacuated than non-Indigenous communities and are more susceptible to public health emergencies. For Inuit, climate change is causing permafrost to thaw is affecting infrastructure and causing sea ice to disappear which is threatening the animals they rely on for food and creating space for invasive species from the South as the water warms. The last decade has been the warmest on record throughout North America. Factors such as climate change, overall forest health, and increased development into wildland areas across the country have increased the threat to Indigenous communities. Recent wildfire seasons have illustrated the increased risk of Indigenous communities to wildfire, with the potential of devastating loss. Meanwhile, some First Nation communities need to be evacuated on a near-annual basis due to flooding. Further, we have been made even more keenly aware of the risks a pandemic like COVID-19 could have on remote Indigenous communities, with less access to health services, higher rates of pre-existing conditions (e.g., higher rates of tuberculosis in Inuit communities), and other socioeconomic factors such as food insecurity and mental wellness crises.
Understanding the challenges associated with this complex delivery environment is key to addressing obstacles that perpetuate socioeconomic gaps. Acknowledging that Indigenous communities experience and prioritize issues differently (through partnership and dialogue with those communities) allows the department to adjust approaches, change attitudes, and identify where further financial investments are required to improve access, close socioeconomic gaps and to work toward substantive equality.
Improving access to core services
Despite these complexities, Indigenous Services Canada's first order of business remains the delivery of core services to all Indigenous peoples, in a way that addresses their unique needs and circumstances. Over the last several years, the Government of Canada has invested significantly in closing gaps in access to services. A respectful approach that includes dialogue and partnerships is a fundamental first step to closing socioeconomic gaps, but it is clear that these efforts will fall short if they are not also properly resourced financially.
Indigenous Services Canada is increasing service-access and closing socioeconomic gaps by using a distinctions-based, as well as a place-based, approach that takes into account the unique needs of urban, rural, remote and northern environments in the delivery and promotion of services. In doing so, Indigenous Services Canada is well placed to support Indigenous partners in the design, implementation and evaluation of services that best address the socioeconomic gaps they face.
Key recent efforts to close gaps in access to services include the following:
Potable water and community infrastructure
Indigenous Services Canada works with First Nation governments and communities to support adequate and sustainable housing, clean drinking water and community infrastructure such as schools, roads, and wastewater systems, which are essential to healthy, safe and prosperous communities.
The Government of Canada has committed to making unprecedented investments in support of Indigenous community infrastructure. More than $8 billion of committed and proposed funding through Indigenous Services Canada is being used to support Indigenous community infrastructure until 2026–2027. To address community infrastructure needs, the department has invested approximately $4.1 billion since 2016 to support 4,650 community infrastructure projects. These projects included initiatives to address long-term drinking water advisories, build and renovate homes to help ensure that First Nations have access to safe, secure spaces in which to live (a total 1,561 new homes and 3,169 renovated homes), and build, renovate or upgrade schools to create quality learning environments and promote better educational outcomes for First Nations students living on reserve (a total of 18 new schools and 58 schools renovated or upgraded). This also included the completion of 197 health-related infrastructure projects for renovating, expanding or constructing First Nations health facilities, such as nursing stations, health centres, residences, as well as sites hosting Aboriginal Head Start On Reserve programming.
In total, there have been 619 water and wastewater projects initiated or completed since Budget 2016. These projects include new, upgraded or repaired infrastructure, as well as feasibility and design studies to ensure that First Nations have the right infrastructure systems in place for growing communities. To date, 331 water and wastewater projects have been completed and another 288 are underway, benefitting 586 First Nation communities across the country. As of September 10, 2020, 91 long-term drinking water advisories have been lifted, and since November 2015 162 short-term drinking water advisories lasting between two and 12 months have been lifted before becoming long-term.
Jordan's Principle and Inuit Child First Initiative
Geographical, systemic, and policy-related challenges have created a situation where Indigenous communities have limited access to doctors, registered nurses, medical specialists and other health providers, as well as health-related services. These factors have historically presented challenges to closing the socioeconomic gaps between Indigenous and the non-Indigenous population in Canada. These challenges must not be exacerbated by jurisdictional disputes at the expense of children.
It is for this reason that in 2007, the House of Commons voted unanimously to support Jordan's Principle – a child first principle that ensures that First Nations children receive the health, social and education products, supports and services they require, when and where they need them. The Government is committed to the full implementation of Jordan's Principle. Furthermore, in 2019-20, Indigenous Services Canada implemented the Inuit Child First Initiative to extend the same level of support to Inuit children.
Jordan's Principle and the Inuit Child First Initiative serve as one example of substantial investments that demonstrate Canada's commitment to stabilizing essential services and ensuring that these services are accessible to Indigenous people. Budget 2019 invested $1.2 billion over three years to support the continued implementation of Jordan's Principle. Overall, actual expenditures for First Nations and Inuit health have averaged about $2.7 billion annually over the period 2010-11 to 2017-18.
We are beginning to see the results of these investments. A 2018 client satisfaction survey of recipients of Jordan's Principle funding found that: 98% of respondents reported they were treated with dignity and respect and that 92% were satisfied with the products, supports, and services that they had received.
Child and family services
Child and family services is an area in which Indigenous Services Canada continues to advance important reform with partners, as evidenced by the co-developed legislation on Indigenous child and family services that opens the door to Indigenous control over this essential service.
In keeping with Indigenous Services Canada's six-point plan to reform child and family services, the department also continues to work on fully implementing the Canadian Human Rights Tribunal orders, and has more than doubled funding to child and family services agencies (based on their actual needs and with an emphasis on prevention) from $681 million in 2015-2016 to $1.7 billion in 2019-2020. As part of Budget 2018 investments, Indigenous Services Canada has implemented a new funding stream to fund community well-being and jurisdiction initiatives across the country. These support Indigenous communities in developing and delivering prevention services and working to improve the well-being of children and families, as well as to explore jurisdictional models. As it is based on close relationships and collaborative efforts with Indigenous governments and organizations, the community well-being and jurisdiction initiatives represent a positive and meaningful step towards self-determination.
Family violence prevention
The Family Violence Prevention Program is part of the Government of Canada's effort to end violence against women and girls, stop family violence, and reduce and respond to violence against Indigenous people. The Family Violence Prevention Program provides operational funding to support the day-to-day operations of Indigenous Services Canada's network of 46 emergency shelters on reserve and in the Yukon. This program also supports prevention activities that increase awareness of family violence and provide families and communities with tools to address violence; such as treatment and intervention, stress and anger management seminars, culturally sensitive services (Elder and traditional teachings), as well as public awareness and self-development projects.
Between 2017 and 2018, there were 3,763 women and 1,803 children who accessed Family Violence Prevention Program shelter services, (not including the Yukon). Currently, some 329 First Nation communities (representing approximately 55% of all First Nations in Canada) are served by the Indigenous Services Canada-funded shelters and over 300 family violence prevention projects on and off reserve are supported each year.
In recognition of the need for ongoing and enhanced supports Canada has continued to invest in this area. Funding was provided through Budget 2016 to support the creation of five new family violence prevention shelters. As part of the COVID-19 Economic Response Plan, additional funds have been directed to strengthen family violence prevention supports including: $10 million for Indigenous Services Canada's existing network of 46 shelters to help manage or prevent an outbreak in their facilities; $44.8 million over five years to build 12 new shelters (10 in First Nation communities on reserve and two in the territories) to help protect and support Indigenous women and girls experiencing and escaping violence; $40.8 million to support operational costs for these new shelters over the first five years, and $10.2 million annually ongoing. A further $1 million a year ongoing, starting in 2020, will support engagement with Métis leaders and service providers on shelter provision and community-led violence prevention projects for Métis women, girls and LGBTQ and two-spirited people.
Responding to the Final Report of the National Inquiry into Missing and Murdered Indigenous Women and Girls, is a key priority for the department. This involves collaborating with Crown-Indigenous Relations and Northern Affairs Canada, other federal departments, Indigenous partners, as well as provinces and territories in the development of a National Action Plan. Going forward, the program will continue to strengthen partnerships with other government departments and Indigenous organizations (including the National Aboriginal Circle Against Family Violence, Pauktuutit Inuit Women of Canada, Les Femmes Michif Otipemisiwak – Women of the Métis Nation, and Aboriginal Shelters of Ontario) in order to improve the safety and security of Indigenous women, children and families.
First Nations Education
The new funding and policy approach, which took effect on April 1st, 2019, is an interim measure, and resulted in regional increases in funding of between 14 and 39%. The department continues to work with First Nation partners to refine funding models, identify priorities, and explore opportunities to improve outcomes for First Nations students.
The new co-developed funding approach for elementary and secondary education provides full-day kindergarten on reserve for children ages four and five. In 2019-20, this funding has increased the number of full-day kindergarten programs offered at First Nation schools by over 50%.
Providing access to quality education is fundamental to closing socioeconomic gaps and achieving substantive equality. All children in Canada deserve a chance to reach their full potential, no matter where they live. In 2015, the Government of Canada committed to working collaboratively with Indigenous partners to transform the education system for Indigenous students. As a first step, Budget 2016 invested $2.6 billion over five years to transform the First Nations-specific Elementary and Secondary Program on reserve. Engagement with partners led to an Assembly of First Nations Chiefs-in-Assembly Resolution that enabled the co-development of a new policy approach for funding First Nations elementary and secondary education on reserves. Effective April 1, 2019, new interim regional funding models for elementary and secondary education are now in place to ensure that students attending First Nations schools are supported by predictable base funding that is more directly comparable to what students enrolled in provincial education systems receive. On top of this base funding, additional funding is provided to support language and cultural programming, and full-time kindergarten for children ages four and five in on reserve schools. This approach allows First Nations to be in the driver's seat – ensuring that they are in control of First Nations education.
Aboriginal Entrepreneurship Program
The Aboriginal Entrepreneurship Program seeks to increase the number of viable businesses in Canada owned and controlled by Indigenous people. This is done by building capacity, reducing barriers, increasing access to capital, and by forging partnerships that will increase economic opportunities for First Nations, Inuit, and Métis entrepreneurs.
The Aboriginal Entrepreneurship Program has two components; Access to Capital, and Access to Business Opportunities. The Access to Capital stream supports the National Aboriginal Capital Corporations Association and a network of 59 Aboriginal Financial Institutions which provide Indigenous entrepreneurs with non-repayable contributions, developmental loans and business support services. Through a five-year comprehensive arrangement, the department provides $33.9 million annually to the National Aboriginal Capital Corporations Association to manage and deliver a full suite of economic development programs which supplement and promote access to capital and provide capacity building support. The Access to Business opportunities stream has an annual budget of $850,000 and provides funding to cultivate entrepreneurship in Indigenous communities by improving access to business opportunities for Indigenous businesses, and enhancing the capacity of Indigenous business development organizations. Since 2015, the Business Opportunities Stream has supported 86 projects with funds totaling over $20 million.
Responding to emergencies
To ensure that communities are able to respond to emergencies and crises when and where they arise, Indigenous Services Canada's Emergency Management Assistance Program helps First Nation communities on reserve access emergency assistance services. The program provides funding to First Nation communities to strengthen resiliency, prepare for natural hazards and respond to them using the four pillars of emergency management: mitigation, preparedness, response, and recovery.
We know that many First Nation communities are becoming increasingly vulnerable to climate change related risks because of a variety of factors, which can include: remoteness, community size, socioeconomic conditions, or limited access to emergency management resources. This is why, through the Emergency Management Assistance Program, Indigenous Services Canada is working in partnership with First Nation communities, provincial and territorial governments and non-government organizations to enhance the health and safety of First Nation residents and ensure they have access to emergency assistance services that are comparable to the rest of Canada. Further, the department continues to work towards formalizing emergency management agreements with emphasis on First Nations as full and equal partners integrated into existing emergency management regimes and protocols. To further facilitate emergency preparedness, in 2019-20 Indigenous Services Canada supported 39 new on reserve Emergency Preparedness Coordinator positions within communities, as well as a unique partnership arrangement to provide enhanced capacity at First Nation community and aggregate levels.
Budget 2019 announced $211 million over five years of new investments for First Nations emergency management on reserve to ultimately enhance community resiliency. This included $79.9 million over five years and $17 million ongoing for health emergency preparedness to support health emergency/pandemic planning. Increased program funding, including capacity building and preparedness and mitigation, and raised awareness has enabled a larger number of communities to have access to health emergency management coordinators and to participate in training, preparedness, and mitigation activities. Full engagement of First Nations will ensure that emergency management services are in-line with socioeconomic and cultural distinctions of communities, providing a more solid framework for successful mitigation of impacts and timely recovery.
Conclusion
Going forward, Indigenous Services Canada will continue to focus efforts on increasing Indigenous access to core services that are essential to closing socioeconomic gaps and achieving substantive equality. The department will do this by working with Indigenous partners, using co-developed initiatives, and being ever mindful of the department's ultimate objective to transfer the design, development, delivery and control of high quality, culturally-appropriate services to Indigenous peoples.
Part 3:
Addressing gaps in socioeconomic conditions through the transfer of departmental responsibilities to Indigenous organizations
Introduction
The Department of Indigenous Services Act is clear on the department's mandate to transfer the responsibilities with respect to the development and provision of services to Indigenous organizations. The inclusion of this element in the Act is a deliberate recognition of the essential role that services play in the lives of Indigenous peoples, as well as the role that decision-making about service design, development and delivery plays in providing Indigenous communities with the ability to advance self-determination. This approach is also consistent with recommendations made by the Royal Commission on Aboriginal Peoples and with what the department has heard from First Nations, Inuit, and Métis over the past 25 years. Finally, it is reflective of efforts already underway toward a future where Indigenous communities and organizations control the design, development, and delivery of services.
Advancing this commitment is an important step toward restoring the structures needed and advocated for by Indigenous peoples to advance self-determination and lead the way to addressing gaps in socioeconomic conditions. While the transfer of the responsibility of services will take place incrementally and will vary depending on service area and community readiness, it will also require path-breaking solutions to ensure that the delivery of services aligns with the needs of the community and is done in a culturally relevant way as determined by the community. It is vital, therefore, that the transfer of services be Indigenous-led, guided by principles of self-determination, and advances at a pace established by First Nations, Inuit, and Métis communities, institutions and organizations. In this way, the prevention of cultural and legal mistakes, stemming from top-down, colonial design in the delivery of services will not be repeated. The transfer of the design, development and delivery of services must also align with self-government initiatives, which experience has shown to deliver better outcomes for Indigenous peoples.
It is also essential to recognize that the transfer of services alone will not be enough to close socioeconomic gaps or advance substantive equality. Addressing gaps in socioeconomic conditions will require strategic investments in key areas that have the potential to generate economic development, address the social determinants of health, and provide support to Indigenous peoples to fully participate in Canada's social and economic fabric. Such investments can be catalysts to support self-determination and achieve substantive equality, as discussed earlier in this report.
Service transfer
Readiness is an essential prerequisite to service transfer on the part of both the federal government and Indigenous-led organizations. To establish the conditions for successful transfer of services, Indigenous Services Canada, along with other federal partners, has work to do internally to prepare for and realize change. This includes ensuring sufficient funding levels, improving program outcomes through greater Indigenous jurisdiction and control, and developing the legal and policy parameters to provide for mutual accountability under new arrangements. Progress towards the transfer of responsibilities as reflected in the 10-year grant under the New Fiscal Relationship program and the establishment of the First Nation's Health Authority in British Columbia, offer some indication of the extensive work required ahead. Indigenous Services Canada will be guided in its work by the new departmental Strategic Plan which seeks to instill guiding principles throughout the department's work culture: "The way we work is grounded in two guiding principles. We respect the diversity of Indigenous cultures and see their influence in the way we work. We recognize that good and honest partnerships are at the core of how we do things."
Placing Indigenous partners' distinct, lived experiences at the centre of service transfer strategies can help achieve substantive equality for communities and individuals at the grassroots level. Indigenous entities and institutions that reflect and meet the distinct needs of their citizens – culturally, linguistically, geographically, socially, economically, and operationally – are better placed to identify and address the various health, educational, social, and economic challenges facing their citizens. The work to change these complex systems and legal arrangements will require careful attention and the active participation of many different partners that currently have a role in service design and delivery. Different arrangements may be needed to transfer services at the scale required to ensure the service can be sustainably and effectively delivered. In some cases this might be at the community level, in others several communities or organizations may need to come together at an aggregate level to pool resources and expertise. The most appropriate model will be determined on a case by case basis, be informed by the needs of service users, and build on existing best practices such as the First Nations Health Authority in British Columbia.
To ensure that Indigenous partners are also ready to assume responsibility for services, support will be required to create the needed structures, institutions, organizations, and linkages to other systems. Enhancing Indigenous control over the design, development, and delivery of services, especially for core services (e.g., education, health, etc.), is a critical step needed in order to realize a future state in which Indigenous Services Canada has fulfilled its mandate under the Act that created the department with an eye towards its devolution. Some progress has already been made in this area in the context of health service delivery where self-determination has been identified as a key determinant of health.
There are persistent challenges and barriers in the provision of services to Indigenous peoples by both Indigenous Services Canada and other service providers that will likely continue until substantive equality is achieved and self-determination is advanced. While work is underway to move toward the transfer of control of services, Indigenous Services Canada will need to continue to meet its existing obligations and address emergency situations as they arise (e.g., fires, flooding, pandemics, etc.). Addressing gaps in socioeconomic conditions and access challenges will also provide a better platform from which Indigenous-led organizations can successfully manage and control the delivery of services to communities.
Canada has a rapidly expanding and diverse institutional landscape. A highly competent Indigenous public sector has been building over the last several years which will support more productive and informed processes, and build on existing relationships, best practices and lessons learned. To advance the transfer of services, Indigenous Services Canada is also working with other federal departments, and provincial and territorial counterparts, who have various roles in the provision of services to Indigenous peoples.
Key recent efforts to transfer the control over the delivery of services to Indigenous organizations include the following:
Healthcare
Over the years, and to varying degrees, Indigenous Services Canada has transferred responsibility for the management of programs and services and specific health facilities to First Nations and Inuit. This includes the transfer of some health programming and services to 25 First Nations and Inuit self-governments, comprising 43 Indigenous communities, as well as the delivery of all First Nations and Inuit Health Branch programs and services in British Columbia. The most advanced model of First Nations health transfer is in British Columbia where a tripartite Framework Agreement was signed in 2011 and led to the full devolution of the First Nations and Inuit Health Branch's regional operations to a newly established First Nations Health Authority in 2013. As per the BC Tripartite Framework Agreement on First Nation Health Governance, the First Nations Health Authority is responsible for delivery of certain health programs and services to First Nations in British Columbia. In light of the positive outcomes of this approach, the department has since accelerated regional and sub-regional transformation initiatives, and capacity development initiatives, to better support First Nations to design, deliver and control their own health services. This work is done in collaboration with provincial health systems. Work is also advancing with partners in Manitoba, Quebec, Ontario and Saskatchewan on health system transformation, with $71 million dedicated over three years to support this work.
Recent approaches used during the COVID-19 pandemic also point to ways that service delivery can be used as a mechanism to advance and sustain self-determination. For example, in May 2020, Indigenous Services Canada supported the Sioux Lookout First Nations Health Authority to take over COVID-19 contact tracing as part of the Health Authority's gradual transfer of control in support of the 33 Sioux Lookout First Nation communities. This builds on their past successes with tuberculosis control. As well, the Assembly of Manitoba Chiefs reached the first agreement of its kind with the Province of Manitoba to share COVID-19 epidemiological data to better empower First Nations in their preparedness and response efforts. Indigenous Services Canada also provided $250,000 to the First Nations Information Governance Centre to advance COVID-19 surveillance and research controlled by and for First Nations across Canada in partnership with a strategic alliance of First Nations, Inuit, and Métis researchers and community partners.
First Nations Education
Program areas, such as Education, have begun providing enhanced services that support progress toward the department's mandate to transfer control of the design, development and delivery of services to Indigenous organizations. For example, three Regional Education Agreements have been signed between Canada and Indigenous groups:
- the Kee Tas Kee Now Tribal Council Education Authority Regional Education Agreement, the first agreement of its kind, includes five First Nations and six schools with approximately 1,053 students;
- the Sunchild First Nation Regional Education Agreement, which includes one First Nation and one school with approximately 332 students; and,
- the Athabasca Denesuline Education Authority Agreement which includes three First Nations and four schools with approximately 1,140 students.
The signing of these three Regional Education Agreements marks a significant step towards First Nations control of First Nations education because they recognize the right of First Nations people to make educational decisions that affect their students, to control their own educational institutions, and respond to the unique needs, experiences, beliefs, and values of First Nation students.
First Nations Land Management
In order to maintain momentum, tools will be needed to continue to meet obligations while also advancing the transfer of services to Indigenous-led organizations. A key existing example of this is the ongoing partnership with the Lands Advisory Board and First Nations Land Management Resource Centre. These partnerships were essential to successfully amend the Framework Agreement and the First Nations Land Management Act, in December 2018, that expands the rights and powers available to First Nations. Part of these amendments provide further access to Indian moneys, and expanded First Nation law-making authorities, which are key to closing socioeconomic gaps. Looking forward, Indigenous Services Canada will continue to work with the Lands Advisory Board and First Nations Land Management Resource Centre as they pursue further amendments to the First Nations Land Management Act, as requested by First Nations.
Child and family services
After extensive co-development with partners, An Act respecting First Nations, Inuit and Métis children, youth and families (the Act) came into force on January 1, 2020. The Act affirms the rights of Indigenous governments to exercise jurisdiction over First Nation, Inuit, and Métis child and family services. It recognizes a simple truth: one size does not fit all when it comes to Indigenous child and family services. Indigenous communities can now develop policies and laws based on their particular histories, cultures, and circumstances. The Act establishes national principles such as best interests of the child, cultural continuity and substantive equality to guide the provision of child and family services in relation to Indigenous children. It also contributes to the implementation of the United Nations Declaration on the Rights of Indigenous Peoples.
To develop best practices and identify lessons learned, Indigenous Services Canada is convening a series of community, regional and national distinctions-based discussions among Indigenous communities and organizations. Together with provincial and territorial representatives, these discussions will provide ideas and insights for the smooth transition and implementation of the Act on issues, such as: regulations, governance, capacity building, data sharing, and funding models.
Investments in key areas
Strategic investments in key areas can generate economic development and address social determinants of health, in order to support Indigenous peoples' participation in Canada's social and economic fabric on their own terms. Such investments can also be catalysts to support self-determination and advance efforts toward achieving substantive equality. In the spirit of the prioritization of the transfer of the control over services described above, and in recognition that Indigenous-led service delivery has been shown to be an effective method of addressing gaps in socioeconomic conditions, it is clear that new investments need to be guided and informed by Indigenous perspectives in order to enable the desired transformation.
Recent examples of enabling investments in key areas include the following:
New fiscal relationship for First Nations
One area where Indigenous Services Canada has been working with First Nation partners to design a way forward is in the development of a new fiscal relationship. With the signing of a memorandum of understanding in July 2016, the Government of Canada and the Assembly of First Nations have been working together along with other key partners to establish a new fiscal relationship that moves towards sufficient, predictable and sustainable funding for First Nation communities based on a relationship of mutual accountability. This work is a key step in addressing the disparities and inequities in the socioeconomic conditions between First Nations and other Canadians. Federal Budgets 2018 and 2019 made key financial commitments to support Indigenous institutions and to advance the new fiscal relationship including through governance support.Footnote 53 Results to date stem from a number of proposals made in the report: "A New Approach: Co-Development of a New Fiscal Relationship between Canada and First Nations", and include:
- New Fiscal Relationship Grant for qualified First Nations enhance self-determination by providing greater predictability and flexibility of funding so that recipients can focus on delivering high-quality services to their citizens, while significantly reducing the reporting burden on their communities resulting in 85 First Nations entering into the Grant in 2019-20;
- The creation and implementation of the Assembly of First Nations-Indigenous Services Canada joint advisory committee on fiscal relations;
- The co-development of a national outcomes-based framework which will enable better measuring and reporting on the closure of socioeconomic gaps between First Nations and other Canadians;
- Advancements have also been made with respect to research into co-developed First Nations-led audit and statistical functions;Footnote 54
- The development of a national data governance strategy and coordination of efforts to establish Regional Data Governance Centres were completed and submitted for consideration in 2019/20; and,
- Indigenous Services Canada, in partnership with the Assembly of First Nations and the First Nations Financial Management Board, has been working towards a replacement for the department's default prevention and management policy, including through pilot projects.Footnote 55
Indigenous Services Canada will continue to implement and expand the use of 10-year-grants for qualified First Nations, with 110 First Nations having already entered into the grant as of 2020-21. The important work of the Assembly of First Nations-Indigenous Services Canada Joint Advisory Committee on Fiscal Relations will continue as efforts to co-develop a new fiscal relationship advance, including supporting engagement with First Nations on the Committee's interim report entitled "Honouring our Ancestors by Trailblazing a Path to the Future". Work will continue to develop a broader approach to mutual accountability, which includes collaborative efforts to finalize a National Outcomes-Based Framework, and co-develop First Nations-led audit and statistical functions. Indigenous Services Canada will also continue to work with First Nation partners and organizations to explore innovative approaches to supporting and enhancing governance capacity given that it is a critical element needed to prepare for and facilitate the transfer of services.
Infrastructure
Indigenous Service Canada is working with First Nations on innovative and co-developed approaches for communities to take on responsibility for the delivery of infrastructure services. Through funding provided in Budget 2017, the department is piloting new service delivery models for housing and infrastructure by co-developing transfer of responsibility from Indigenous Services Canada to First Nation-led organizations. In fiscal year 2019/20, the department worked with organizations in British Columbia, Alberta, Saskatchewan, Ontario, Quebec and the Atlantic provinces to advance the work to transfer service responsibility (e.g., Framework Agreement signed in June 2020 to guide negotiation with Atlantic First Nations Water Authority to transfer responsibility for water and wastewater services for 15 First Nations communities in Atlantic Canada from Indigenous Services Canada to the Atlantic First Nations Water Authority). While the work is still in the development phase, the progress of some of the regional entities is moving quite rapidly. The models being considered vary across the country, with a range of ideas related to structure, scope or delivery approaches. The models or concepts explored by First Nations partners support the development of Indigenous-led organizations' authority and capacity over housing and infrastructure. A key related initiative is the co-developed 10-year National First Nations Housing and Related Infrastructure Strategy, which outlines a path to increase the transition of housing program service delivery to First Nations. Work will continue with First Nation partners on the development of an implementation plan.
Indigenous mental wellness continuum
Strengths-based approaches, informed by Indigenous world views, knowledge and experience are the most effective approach to increasing culturally appropriate access to health services, including mental wellness. Examples of existing approaches include:
- The First Nations Mental Wellness Continuum Framework, developed through intensive collaboration between First Nations partners and Indigenous Services Canada, has helped guide communities to better plan, implement, and coordinate comprehensive responses to the full range of mental wellness challenges in a manner consistent with community priorities.
- The National Inuit Suicide Prevention Strategy sets out a series of actions and interventions to address the higher rates of suicide among Inuit. The Strategy promotes a shared understanding of the context, underlying risk factors for suicide, and protective factors that reduce the risk of suicide in Inuit communities while guiding policy at the community, regional, and national levels on an Inuit-specific, evidence-based, and globally-informed approach to suicide prevention.
Indigenous Centre of Expertise for Cumulative Effects Assessment and Management
The Indigenous Centre of Expertise for Cumulative Effects Assessment and Management (the Centre) was created through a co-development process to support the technical and scientific capacity of Indigenous communities to undertake cumulative effects assessment, monitoring, and management, based on the values of First Nations, Inuit, and Métis communities. In November 2019, the Centre was incorporated as a not-for-profit organization and will operate independently from the Government of Canada. The Centre's governance, such as its Board of Directors, will consist of First Nation, Inuit, and Métis representation. It is currently in its developmental phase and is anticipated to be established within the next two years.
Land Use Planning Initiative
The Lands and Economic Development Sector has been transitioning the Land Use Planning Initiative to a partnership model involving the National Aboriginal Lands Managers Association, the First Nations Land Management Resource Centre (the Resource Centre), and Indigenous Services Canada. National Aboriginal Lands Managers Association and the Resource Centre lead the administration of the Land Use Planning Initiative by taking on the development, assessment, and approval of applications; coordination of intake; as well as providing technical support and training to First Nations developing Land Use Plans. They are also responsible for flowing the land use planning funds to First Nations. Since April 2019, a total of 35 First Nations are being supported through the initiative.
Conclusion
The transfer of services to Indigenous-led control and responsibility is intrinsically linked with the Government's commitment to advance self-determination, nation-to-nation, Inuit-to-Crown, and government-to-government relationships and reconciliation. The environment in which the transfer of services is occurring is complex, with many different accountabilities, partners, service areas, delivery mechanisms, funding arrangements and requirements, and linkages with other systems. The momentum for change has been building over many years.
Indigenous Services Canada will work with First Nations, Inuit, and Métis peoples to determine pathways forward that reflect unique needs and choices of different communities. Work to advance Indigenous control over services will continue to occur at both the individual program level, as well as, holistically at the departmental level. To be reflective of the unique needs and situations of Indigenous communities and service areas, it is anticipated that a spectrum of approaches will be implemented. In some situations, Indigenous communities or organizations may be best placed to take full control of the design, development and delivery of services. In others, there may be a need to maintain a larger federal role in delivery or to develop a unique partnership or arrangement to meet the needs of a particular situation. No community or Indigenous-led organization will be compelled to take-on current Indigenous Services Canada responsibilities without their agreement and support.
Going forward, there needs to be a clear understanding of how Indigenous Services Canada and Indigenous communities and organizations will work in partnership to design and implement the transfer of services. This will require discussions, collaboration and will build upon best practices to ensure that the transfer process is consistent, effective and meets the needs of Indigenous peoples. If the transfer of services is to be successful, Indigenous peoples must be equal partners in development processes and in every aspect of the transfers, including options related to funding, data collection, reporting and evaluation methodologies. Indigenous Services Canada will continue to work towards a workforce that is culturally safe, supporting First Nations, Inuit, and Métis communities in creating the design, development, and delivery of high quality, holistic services with better outcomes for their members.
Indigenous Services Canada will also continue to consider strategic investments in key areas that have the potential to support Indigenous communities in advancing their economic development, health, social well-being, and otherwise contribute to their ability to self-determine their future. The department's approach in considering such investments will be consistent with the principles governing our approach to transfer the control of services to Indigenous organizations.